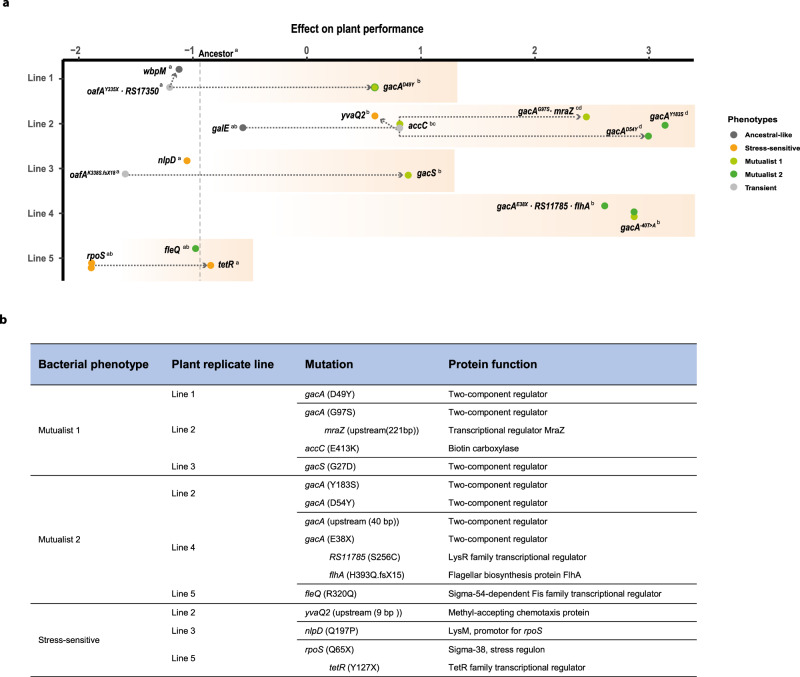
Fig. 4. Genetic basis of bacterial evolution in the rhizosphere of Arabidopsis thaliana.
Panel a shows clear parallel evolution between four out of five plant replicate selection lines based on re-sequencing of 25 evolved and five ancestor isolates used in the phenotypic assays. Filled dots represent isolates with novel mutations (present in 18/25 evolved isolates). The seven isolates without mutations, or only synonymous mutations, are not included. The x-axis shows a combined index of ‘Plant performance’ relative to non-inoculated control plants (values on the x-axis indicate positive and negative effects on the plant and the y-axis shows the five independent plant replicate selection lines). The effect of the ancestral bacterial genotype on plant performance is shown as a vertical dashed line. Statistical testing in panel a was carried out using one-way ANOVA (each line analysed separately). The different letters on the top right of each genotype indicate significant differences based on a Tukey’s HSD test (α = 0.05; each line analysed separately, n = 3). Bacterial phenotype groups are displayed on different colours (black: ancestor; dark grey: ancestral-like; light grey: transient; orange: stress-sensitive, light green: Mutualist 1 and dark green: Mutualist 2) and the accumulation of mutations within replicate lines are shown with connected dashed arrows. Panel b table lists unique mutations linked with evolved bacterial phenotypes. Successive mutations that appeared within the same genetic background are shown after the indent. Notably, these additional mutations did not affect the bacterial phenotypes (see Table S3 for a more detailed description of the mutations). Data for all panels are provided in the Source Data file.

