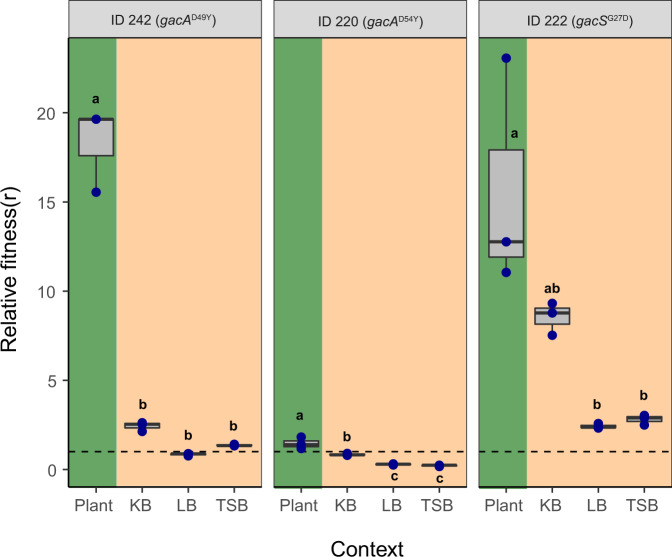
Fig. 5. Competitive fitness of gac mutants relative to their direct ancestors in the rhizosphere and in in vitro culture media.
The gac mutants’ relative fitness (r) was calculated based on the deviation from the initial 1:1 genotype ratio (dashed line) after direct competition in different environments. Fitness values above the dashed line indicate a higher competitive advantage of gac mutants relative to their ancestral genotypes without gac mutations (Table S2), whereas values below the dashed line denote for decreased competitive ability of evolved gac mutants. In all panels, green and beige backgrounds denote competition assays conducted in the rhizosphere and in standard culture media, respectively. All boxplots show median (centre line), interquartile range (25–75%) and whiskers that extended 1.5 times the interquartile range overlaid with a scatter plot showing independent replicates (n = 3). Different small letters above the boxplots represent significant differences in relative fitness (r) between growth conditions for each mutant (one-way ANOVA, Tukey’s HSD test, α = 0.05). Data for all panels are provided in the Source Data file.

