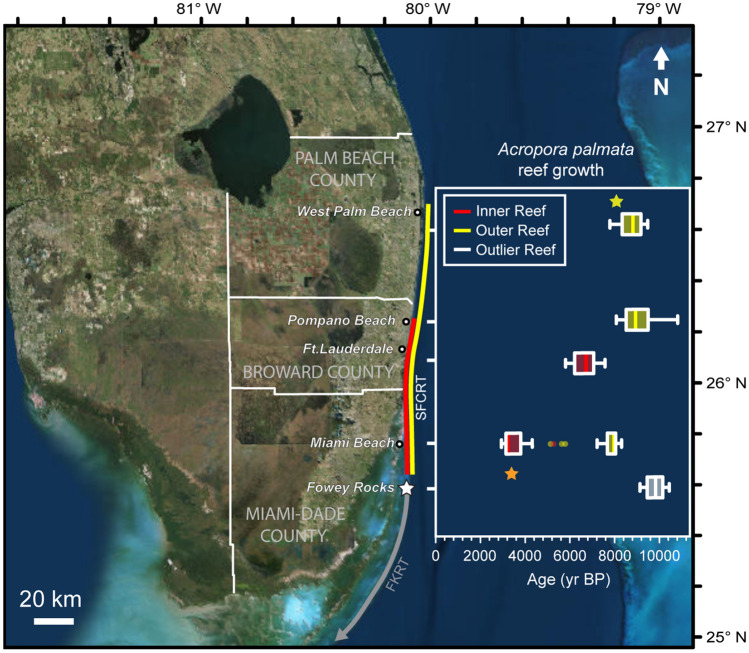
Figure 2.
Map of the extent of the Southeast Florida Continental Reef Tract’s (SFCRT) Inner Reef (red line) and Outer Reef (yellow line) and timing of Acropora palmata reef growth at sampling locations (boxplots). Boxplots represent the medians (solid verticals) and interquartile ranges (boxes) of radiometric ages of A. palmata from each location. Error bars (whiskers) are 1.5 × the interquartile range. Points indicate data outside this range. The two stars indicate ages from A. palmata sampled at the northern limit (yellow, Outer Reef) and southern limit (orange, convergence of the Outer and Inner Reefs) of the Southeast Florida Continental Reef Tract. Data from the Outlier Reef at Fowey Rocks (white star), Florida Keys Reef Tract (FKRT; grey line) are also shown for comparison. Ages from the Inner Reef in Palm Beach and Miami-Dade Counties are reef-surface samples, whereas the other locations also include subsurface samples. Map image is the intellectual property of Esri and is used herein under license.
Copyright 2020 Esri and its licensors. All rights reserved.

