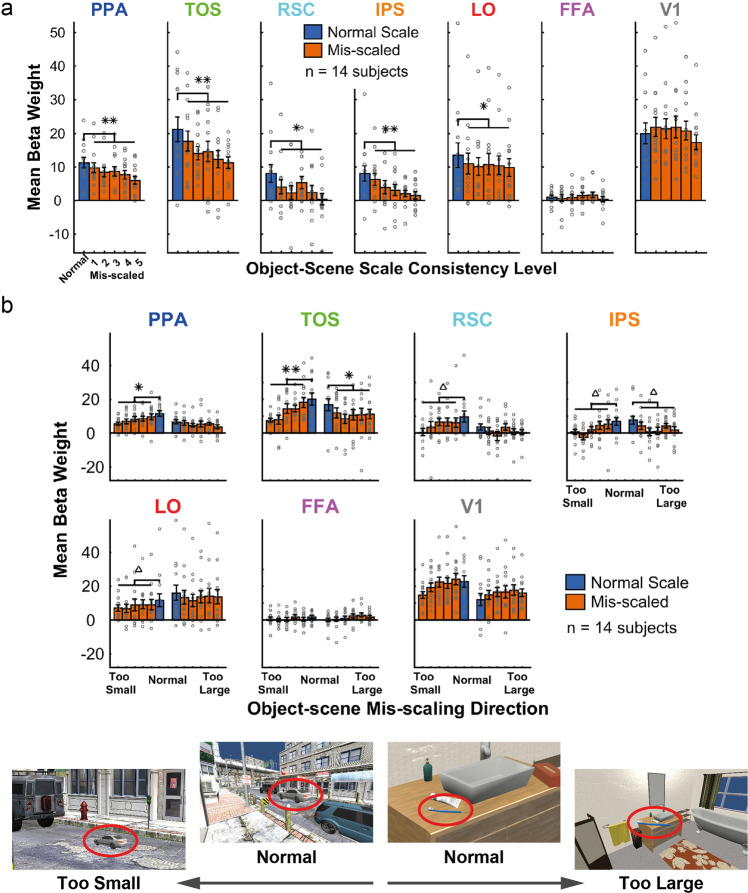
Fig. 2. GLM results.
Mean beta weights with SEM error bars (a) across object-scene scale consistency levels, in each ROI; b across object-scene scale consistency levels, where conditions are split by mis-scaling direction (half of the objects are in each mis-scaling direction). Significant differences between normal scale consistency levels and the mean of the mis-scaled levels are indicated above the relevant plots, tested for significance with permutation tests: **p < .001, *p < .01, Δp < .05 (1000 permutations, one-tailed, FDR corrected). Example images, with targets (circled red) corresponding to normal, too small, and too large, are shown below the plots. Error bars show the standard error of the mean (SEM). Individual subject data points are overlaid on the bars as gray circles.

