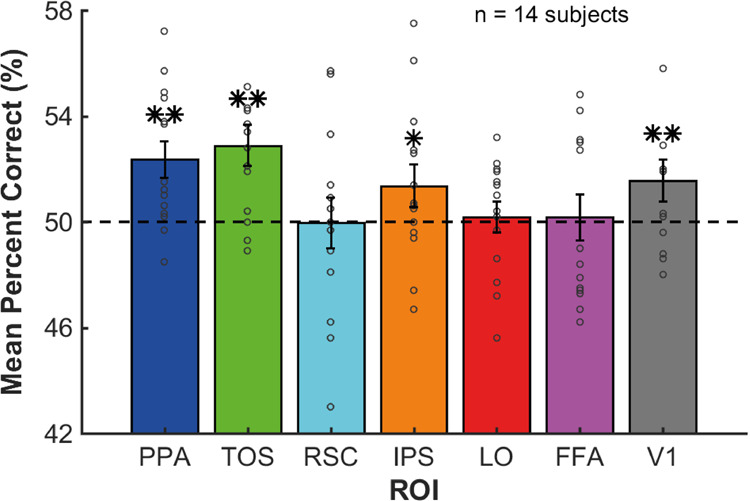
Fig. 3. MVPA output.

Mean percent correct (PC) (%) across subjects from the MVPA for each ROI. Permutation tests were performed to determine whether the mean PC values were significantly different from chance (50%). These were FDR corrected across ROIs: **p < .001, *p < .01, 1000 permutations, one-tailed, FDR corrected across ROIs. The dashed black line at 50% indicates chance level of percent correct responses. Error bars show the SEM. Individual subject data points are overlaid on the bars as gray circles.
