
Figure 1.
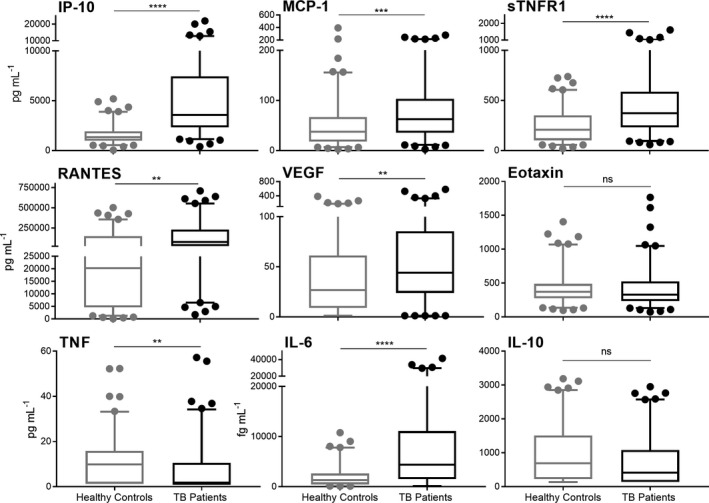
Expression of nine plasma proteins in 100 TB patients at diagnosis (treatment naïve) compared to age‐ and sex‐matched healthy controls. Data are represented by boxplots with median and interquartile range with bars from the 5–95 percentile. Samples were statistically analysed by Welch’s t‐test (ns = no significance, **P‐value < 0.01, ***P‐value < 0.001, ****P‐value < 0.0001).