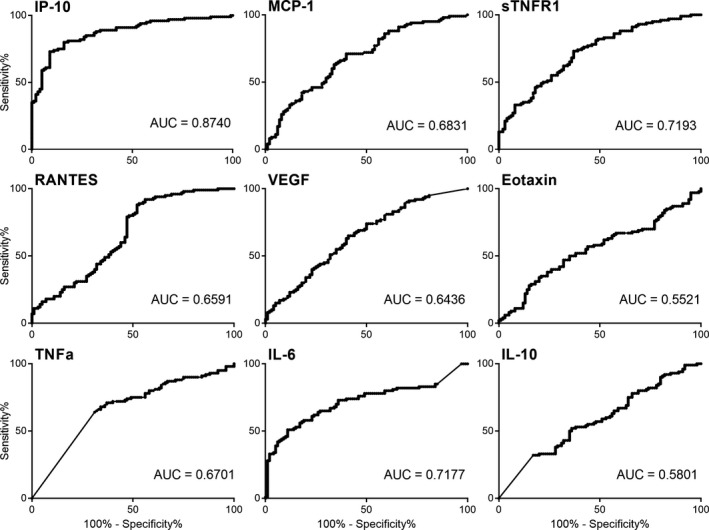
Figure 2.

ROC curves and AUC values for the nine individual proteins to distinguish TB patients at time of diagnosis from controls. IP‐10 plasma levels generated the best diagnostic accuracy from the nine proteins with an AUC = 0.874. AUC, area under the curve; ROC, receiver operator characteristic.
