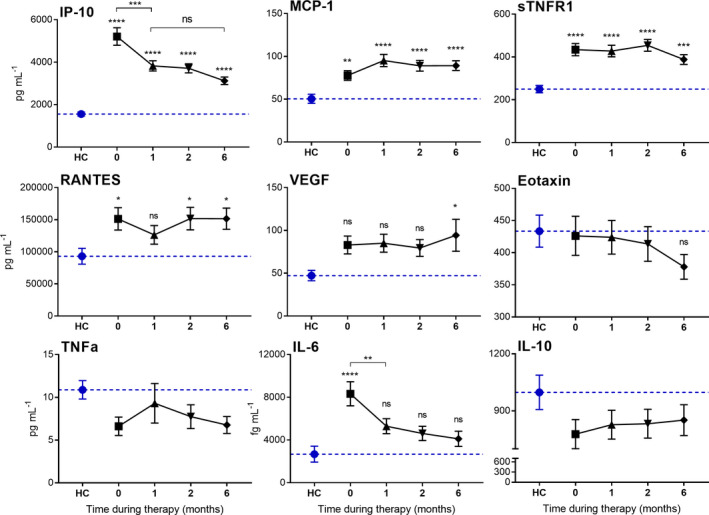
Figure 4.

Expression of nine plasma proteins in TB patients during 6 months of standard TB treatment and in healthy control subjects (HC). Data are mean ± SEM, n = 100 per group. The dotted line is representative of the mean protein level for the HC cohort. Statistical differences in levels compared to healthy controls were assessed by one‐way ANOVA with Tukey’s multiple comparisons test (ns = no significance, *P‐value < 0.05, **P‐value < 0.01, ***P‐value < 0.001, ****P‐value < 0.0001).
