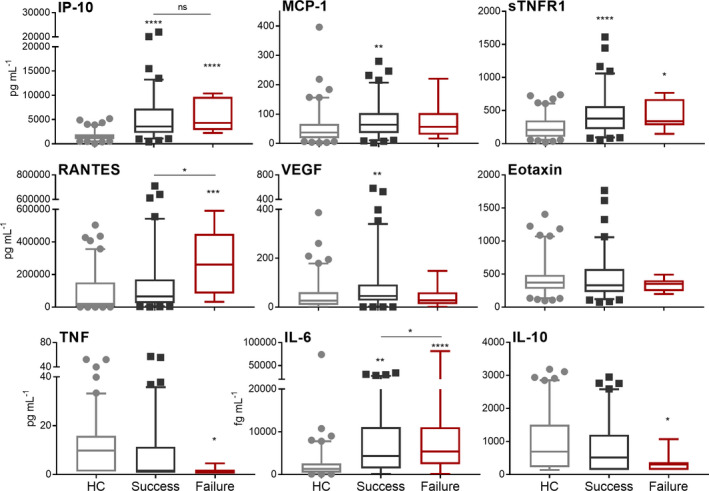
Figure 5.

Plasma protein levels in TB patients at time of diagnosis (treatment naïve) who successfully completed standard therapy (n = 89, black) or who failed therapy (n = 11, red) compared to levels in controls (n = 100, grey). Statistical differences were assessed by one‐way ANOVA with Tukey’s multiple comparisons test. Significant differences displayed are relative to the HC group unless otherwise indicated (ns = no significance, *P‐value < 0.05, **P‐value < 0.01, ***P‐value < 0.001, ****P‐value < 0.0001).
