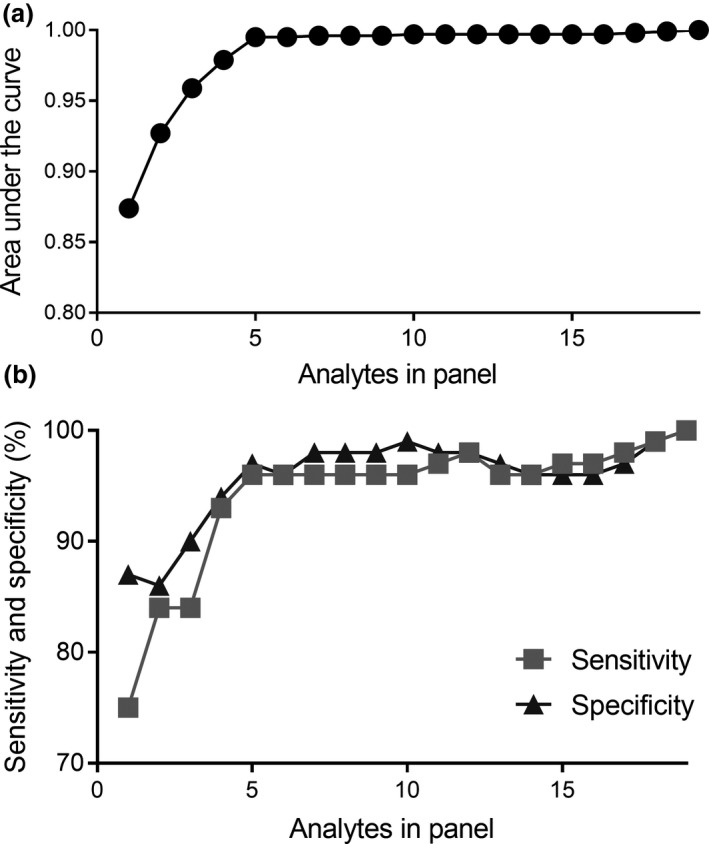
Figure 6.

The area under the curve (a), sensitivity and specificity (b) for varying the number of plasma analytes in a biomarker signature to distinguish active TB patients from control subjects. The 19 analytes consisted of nine proteins measured in this study and 10 miRNA reported in a previous study. 12 The best single biomarker candidate was IP‐10.
