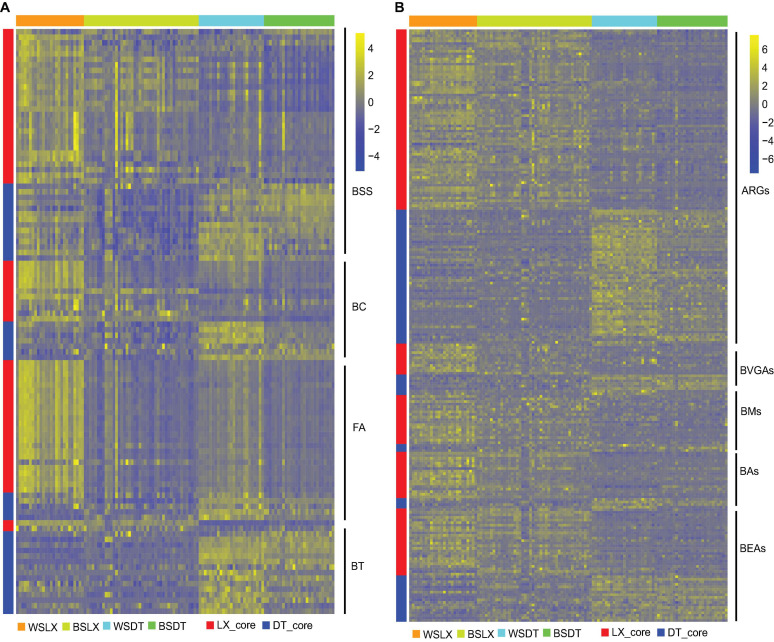
FIGURE 10.
Relative abundances of core rhizosphere KOs in different planting patterns. (A) The relative abundance of core rhizosphere KOs involved in plant–microbe and microbe–microbe interactions. (B) The relative abundance of core rhizosphere KOs involved in antimicrobial resistant genes (ARGs), antibiotic synthesis genes (ASGs). Scale, relative abundance of KO at row normalization by removing the mean (centering) and dividing by the standard deviation (scaling). The color from blue to yellow represents a relative abundance of each KO from low to high. WSDT, rhizosphere soil of cropland planting in Wenshan City; WSLX, rhizosphere soil of understory planting in Wenshan City; BSDT, rhizosphere soil of cropland planting in Baise City; BSLX, rhizosphere soil of understory planting in Baise City; BSS, bacterial secretion systems; BC, bacterial chemotaxis; FA, flagellar assembly; BT, bacterial toxins; ARGs, antimicrobial resistant genes; BVGAs, biosynthesis of vancomycin group antibiotics; BMs. biosynthesis of 12-, 14-, and 16-membered macrolides; Bas, biosynthesis of ansamycins; BEAs, biosynthesis of enediyne antibiotics.

