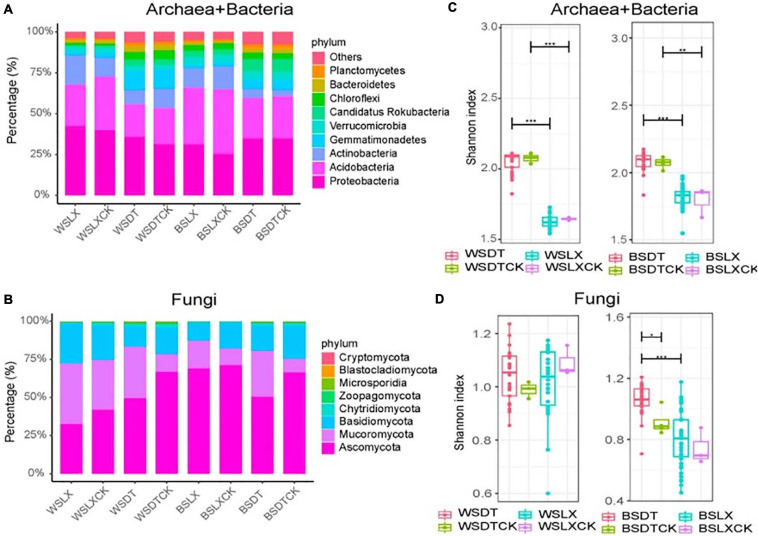
FIGURE 2.
Taxonomic distribution and diversity comparisons in P. notoginseng rhizosphere (n = 122) and bulk soil (n = 13) microbiomes across different sites. (A,B) Phyla-level distributions of prokaryotes and fungi in the bulk soil and rhizosphere samples based on metagenomic data. (C,D) Alpha diversity comparison between the bulk soil and rhizosphere samples from each location based on the Shannon index using the metagenomic data; *P < 0.05; **P < 0.01; ***P < 0.001. One-sided t-test; center value represents the median of the Shannon index. WSDT, rhizosphere soil of cropland planting in Wenshan city; WSDTCK, bulk soil of cropland planting in Wenshan City; WSLX, rhizosphere soil of understory planting in Wenshan City; WSLXCK, bulk soil of understory planting in Wenshan City; BSDT, rhizosphere soil of cropland planting in Baise City; BSDTCK, bulk soil of cropland planting in Baise City; BSLX, rhizosphere soil of understory planting in Baise City; BSLXCK, bulk soil of understory planting in Baise City.

