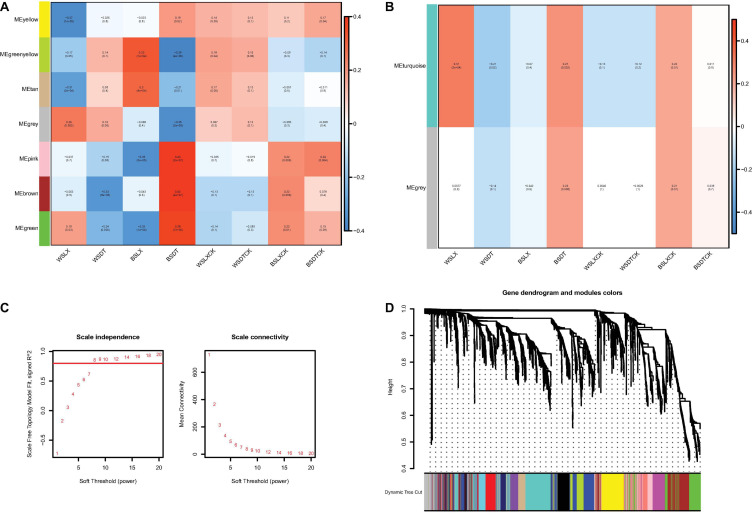
FIGURE 7.
The correlations of microbiomes. Heat map of module-trait relationship in prokaryotes (A) and fungi (B). Each column represents the co-expression module. Red color of each box represents the positive correlation between module and trait. Blue color of each box represents the negative relationships between module and trait. The darker the module color, the more significant their relationship. (C) Estimation of soft-thresholding values in prokaryotes. Scale independence and mean connectivity of various soft-thresholding values (β), power of β = 11 (scale free R2 = 0.8). (D) Dendrogram of all prokaryotes enriched according to a dissimilarity measure (1-TOM) and the cluster module colors. The first set of modules was obtained with dynamic tree cut algorithm and the correlated modules were merged together. Each branch in the figure represents one genus and every color below represents one co-expression module.

