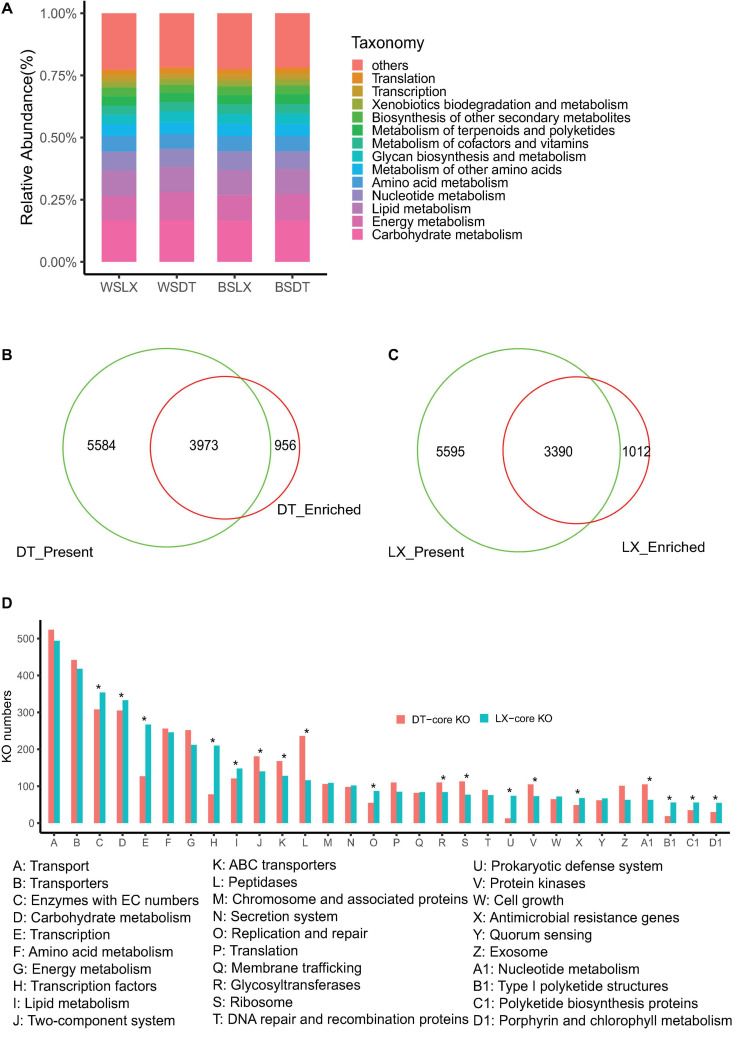
FIGURE 9.
Characterization of the core function of the P. notoginsen rhizosphere microbiome in different planting patterns. (A) Functional KEGG level 2 pathway comparison of P. notoginsen rhizosphere microbiomes. (B) Venn plot depicting the number of core rhizosphere KOs based on the presence rate (>75%) in all understory planting samples, the KOs have a higher relative abundance in understory planting than in cropland planting. (C) Venn plot depicting the number of core rhizosphere KOs based on the presence rate (>5%) in all cropland plantin samples, the KOs have a higher relative abundance in cropland planting than in understory planting. (D) The distributions of the rhizosphere core KOs in the KEGG level 3 pathways. Asterisk indicates a significant difference with P < 0.05 (MW test). WSDT, rhizosphere soil of cropland planting in Wenshan City, WSLX, rhizosphere soil of understory planting in Wenshan City; BSDT, rhizosphere soil of cropland planting in Baise City; BSLX, rhizosphere soil of understory planting in Baise City.

