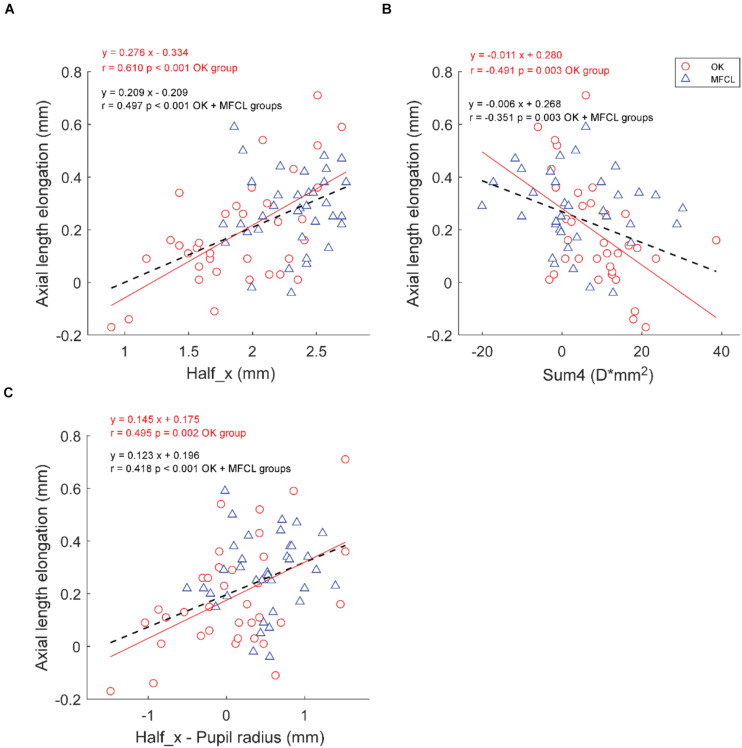
FIGURE 4.
Association between axial length elongation and RCRPS parameters (A) Half_x, (B) Sum4, (C) Half_x – Pupil radius for the OK group (red circles) and the MFCL group (blue triangles). The red solid line is the regression line of the OK data; the black dashed line is the regression line of the combined data. RCRPS, relative corneal refractive power shift; D, diopter; OK, orthokeratology; MFCL, multifocal soft contact lens; combined data: OK and MFCL; Half_x, the corneal eccentric location where RCRPS reached the half peak value; Sum4, the integrated value of the RCRPS located within an area of 4-mm diameter.

