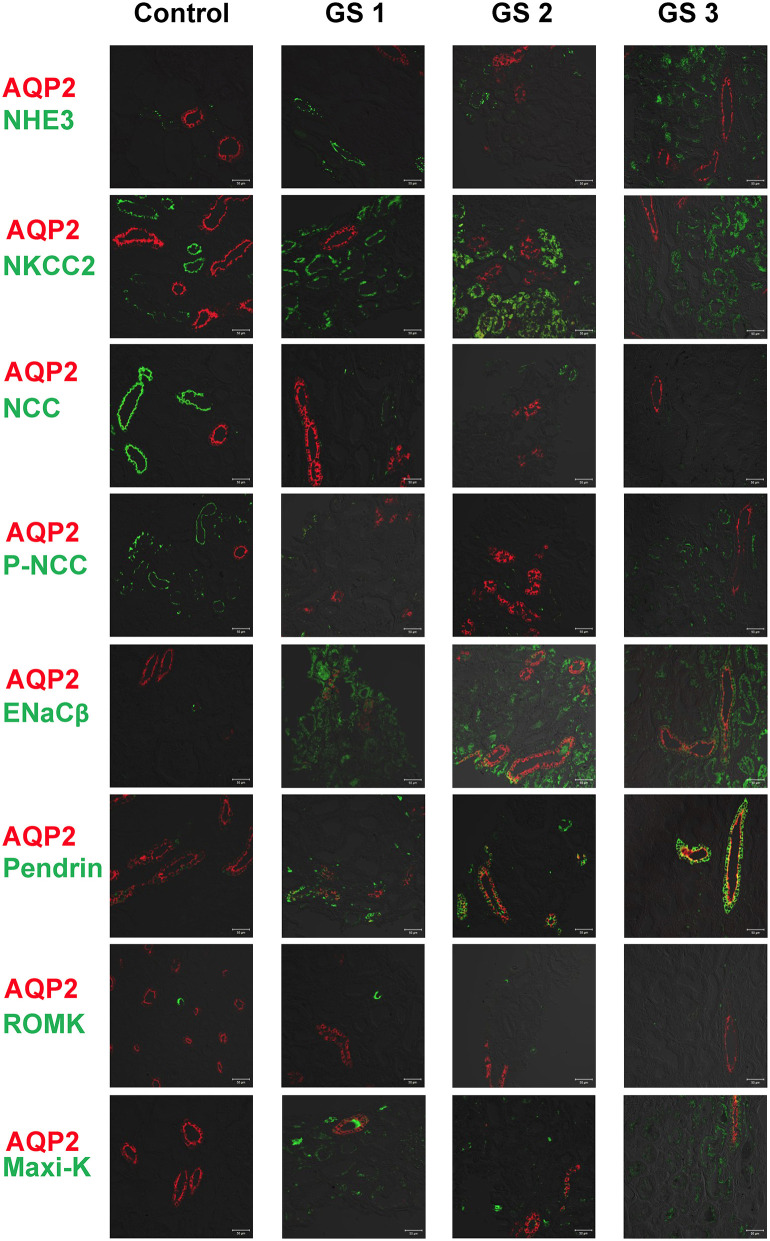
Figure 3.
Immunofluorescence of biopsied kidney tissues from another 3 representative GS patients (GS 1, GS 2, and GS 3) compared with the control kidney tissue. Renal transporters including NHE3, NKCC2, NCC, p-NCC, ENaCβ, pendrin, ROMK, Maxi-K were stained with green. AQP2 was stained with red for localization. Scale bar, 50 μm.

