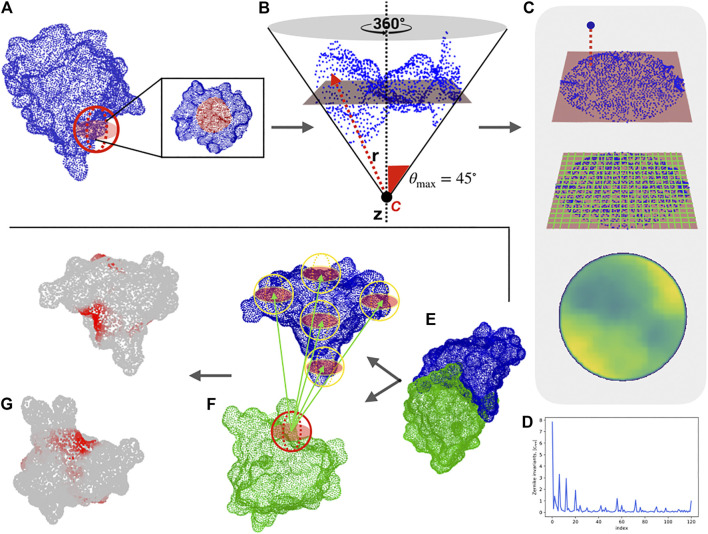
FIGURE 1.
Computational protocol for the characterization of each surface region and the blind identification of the binding sites. (A) Molecular solvent-accessible surface of a protein (in blue) and example of patch selection (red sphere). (B) The selected patch points are fitted with a plane and reoriented in such a way that the z-axis (dotted line) passes through the centroid of the points and is orthogonal to the plane. A point C along the z-axis is defined, such as that the largest angle between the perpendicular axis and the secant connecting C to a surface point is equal to 45°. Finally, to each point, its distance, r with point C is evaluated. (C) Each point of the surface is projected on the fit plane, which is binned with a square grid. To each pixel, the average of the r values of the points inside the pixel is associated. (D) The resulting 2D projection of the patch can be represented by a set of 2D Zernike invariant descriptors. (E–F) Given a protein-protein complex (PDB code: 3B0F, in this example), for each surface vertex we select a patch centered on it and compute its Zernike descriptors. To blindly identify the binding sites, each sampled patch is compared with all the patches of the molecular partner, after which the minimum distance between its patch and all the patches of the molecular partner is associated with each vertex. (G) The surface point values are smoothed to highlight the signal in the regions characterized mostly by low distance values, (i.e. high shape complementarity).

