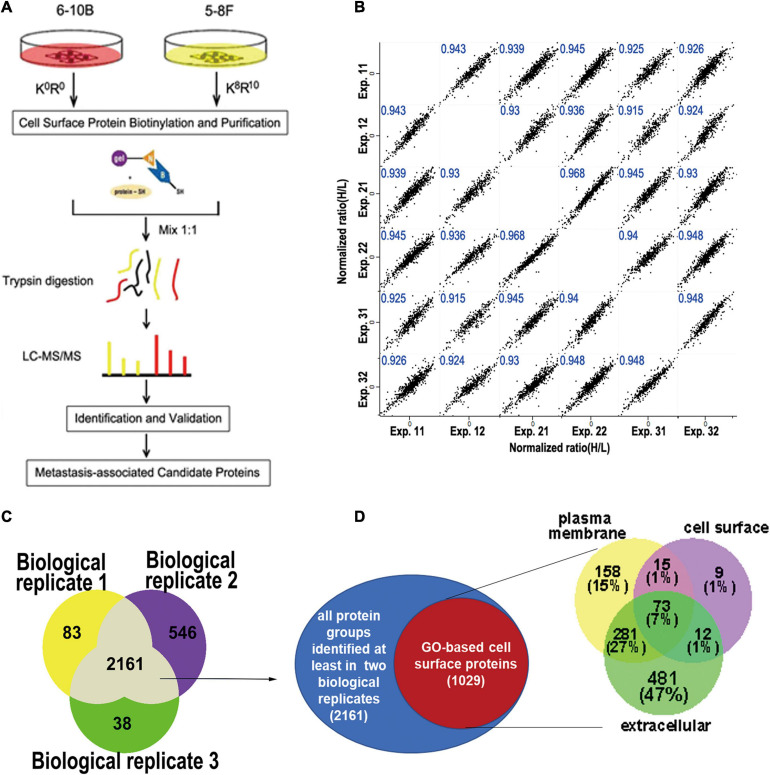
FIGURE 1.
Experimental workflow for cell surface labeling and preparation for mass spectrometry. (A) Workflow of SILAC mass spectrometry-based analysis of the cell surface proteome, where 6-10b and 5-8F cells were labeled with “light” and “heavy” amino acids, respectively. (B) Scatter plot of protein ratio (5-8F vs. 6-10B) between the biological and technical replicates of the cell surface proteome. The Pearson correlation coefficient is presented in blue at the top of each plot. (C) Venn diagram showing the number of identified proteins from three biological replicate experiments. (D) Identified proteins grouped by their annotated subcellular localization (UniProtKB). Surface-exposed proteins represented by their annotated detailed categories are shown in the Venn diagram.

