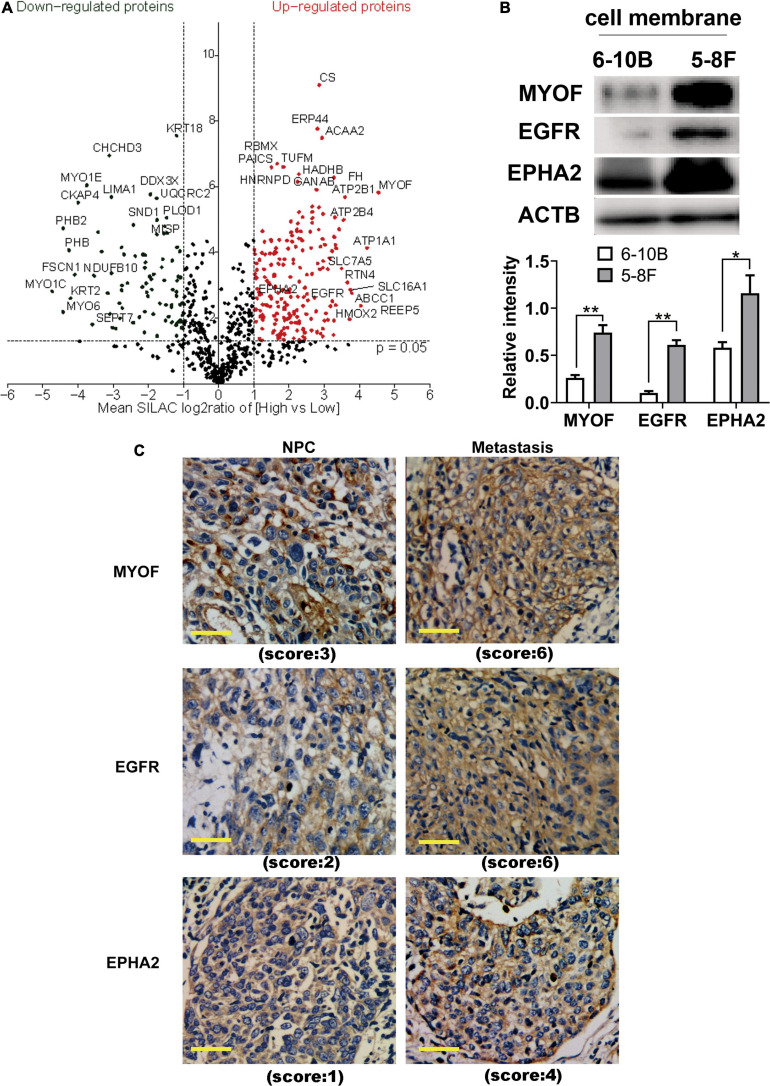
FIGURE 2.
Identification and evaluation of significantly altered proteins between the 6-10B and 5-8F cell lines. (A) Volcano plot indicating significantly altered surface-exposed proteins identified in the datasets. Log-transformed P-values (t-test) against log-transformed fold change in abundance between 6-10B and 5-8F cells. (B) Western blot analysis evaluating the expression of proteins that reside in the plasma membrane. The density of the bands was analyzed by using NIH ImageJ software and normalized by the arbitrary units of b-actin. Data are the means ± SDs of 3 experiments. **p < 0.05 and **p < 0.01. (C) Representative immunohistochemistry (IHC) results showing increased detection of the indicated proteins in NPC with metastasis compared with NPC without metastasis.

