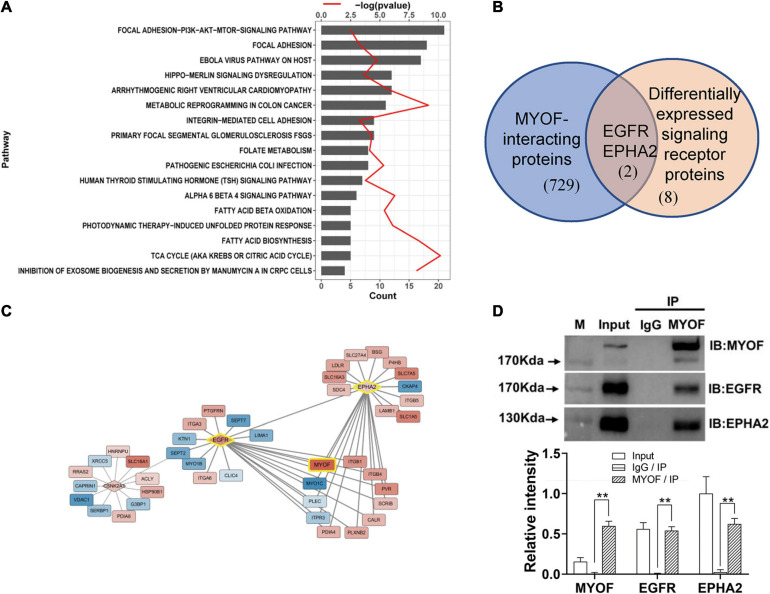
FIGURE 3.
Signaling pathway enrichment analysis and interaction network analysis of DEPs (A) Enriched Wikipathway for differentially expressed surface-exposed proteins in 5-8F cell lines vs. 6-10B cell lines. (B) Overlapping of MYOF-interacting proteins and differentially expressed signaling receptors in 5-8F vs. 6-10B cells. MYOF-interacting proteins were retrieved using Harmonizome. (C) Partial interaction network of differentially expressed proteins focused on the interaction of MYOF, EGFR and EPHA2. (D) The interactions of MYOF with EGFR and EPHA2 were confirmed by Co-IP assay. Co-IP using anti-MYOF and negative control antibodies were performed in 5-8F cells. Western blots for all three proteins were performed. The density of the bands was analyzed by using NIH ImageJ software and normalized by the arbitrary units of the band of the input of EphA2. Data are the means ± SDs of 3 experiments. **p < 0.05 and **p < 0.01.

