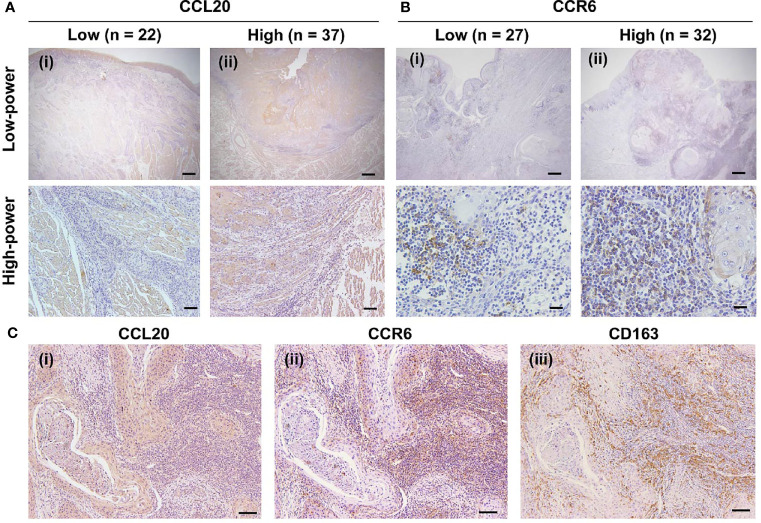
Figure 3.
Expression of CCR20 and CCR6 in macrophages in human TSCC tissue specimens. (A) CCL20 immunoreaction in whole tissues was evaluated and classified into a low group (n = 22) and a high group (n = 37). Representative images of the low and high groups are shown in (i) and (ii), respectively. Original magnification ×40; scale bar, 200 µm (low-power). Original magnification ×100; scale bar, 100 µm (high-power). (B) CCR6 immunoreaction in the stromal area was evaluated and classified into the low group (n = 27) and the high group (n = 32) groups. The representative images for low and high groups are shown in (i) and (ii), respectively. Original magnification ×40; scale bar, 200 µm (low-power). Original magnification ×200; scale bar, 50 µm (high-power). (C) Representative images showing the correlation of high expression levels of CCL20 and CCR6 with the infiltration of CD163-positive macrophages expression. In the high expression level of both CCR20 (i) and CCR6 (ii), strong and diffuse immunoreactivity of CD163 were seen (iii). Original magnification ×100; scale bar, 100 µm.

