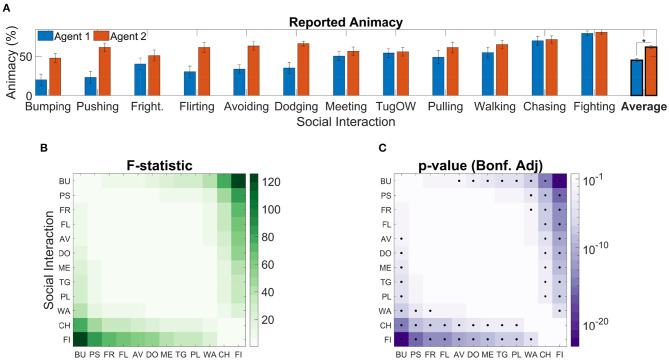
Figure 3.
Reported agent animacy. (A) Mean animacy ratings obtained in Experiment 1; error bars represent standard errors; results are rescaled between 0 and 100. Classes are sorted in ascending order by average across-agent animacy rating. The asterisk denotes a significant effect (p < 0.05) of Agent on Animacy [F(1,299) = 99.98, p = 1.74 · 10−20]. (B) F-statistics of post-hoc tests to assess the difference in animacy ratings between social interaction classes [i.e., F(1,299)]. (C) Bonferroni adjusted p-values corresponding to the F-statistics reported in (B); black dots represent significant pairwise differences.

