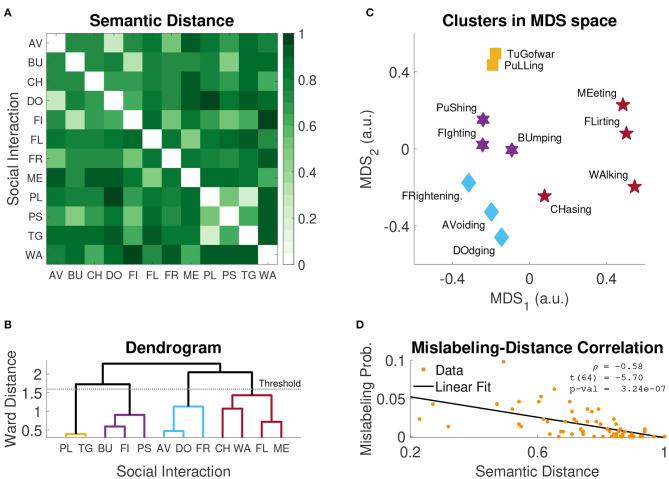
Figure 6.
Cluster analysis results. (A) Average semantic distances obtained in Experiment 3. (B) Dendrogram of hierachical clustering; the horizontal line represents the cut-off threshold used to identify the clusters (i.e., 0.7*MWD, where MWD is the maximum Ward distance). (C) Clusters of social interactions plotted in low dimensional distance-preserving 2D space identified with Multidimensional Scaling (MDS). (D) Average mislabeling probability (Experiment 2) as a function of semantic distance (Experiment 3); inset reports the Pearson's correlation coefficient, the corresponding t-statistic and p-value. AV, avoiding; BU, bumping; CH, chasing; DO, dodging; FI, fighting; FL, flirting; FR, frightening; ME, meeting; PL, pulling; PS, pushing; TG, tug of war; WA, walking.

