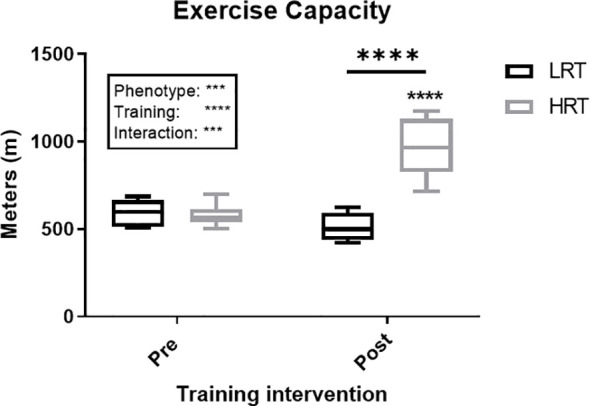
Figure 2.

Change in exercise capacity (meters) in low response trainers (LRT) and high response trainers (HRT). Values are means±SD. Analysis via two-way ANOVA with Sidak’s post hoc test. Main effects are shown in the text box. ***P<0.001, ****P<0.0001. Non-underlined symbols represent within group differences. Underlined symbols represent between group differences.
