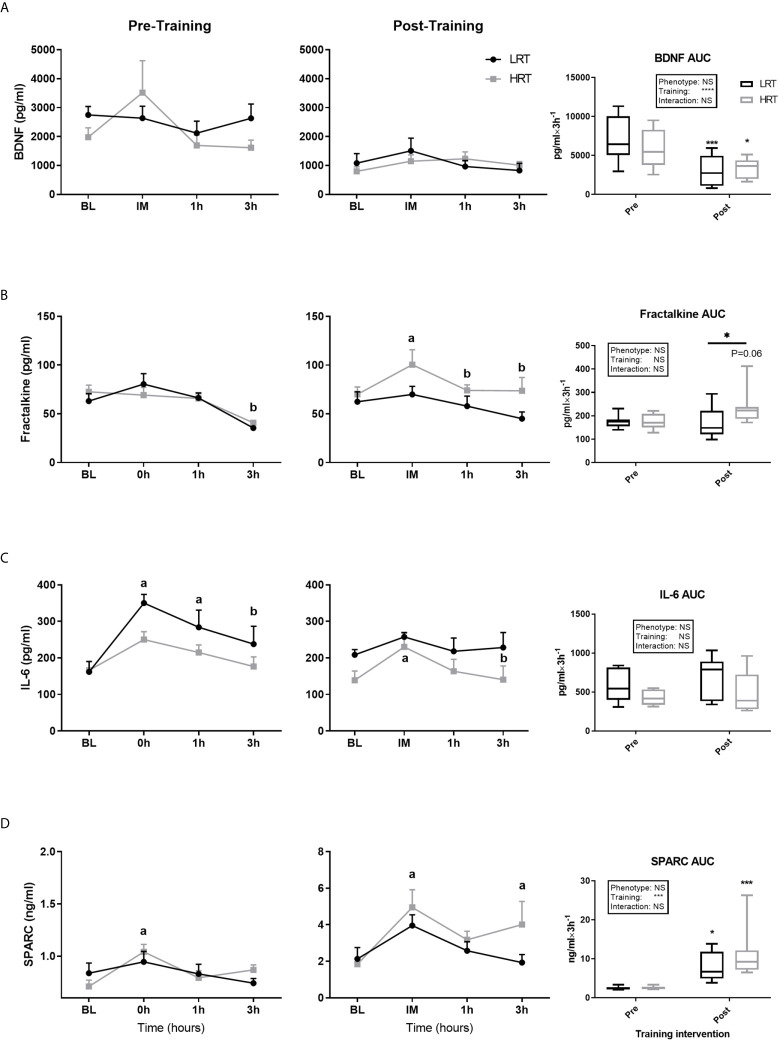
Figure 4.
Temporal change in concentration of plasma myokines and area under the curve (AUC) before and after exercise training. (A) Brain-derived neutrophic factor (BDNF); (B) Fractalkine; (C) Interlukin-6 (IL-6); (D) Secreted protein acidic and rich in cysteine (SPARC); Baseline (BL). Values are means±SD. Analysis via two-way ANOVA with Sidak’s post hoc test. Main effects are shown in the text box. *P<0.05, ***P<0.001, NS, Not Significant. a=significant change from BL. b= significant change from 0h. Non-underlined symbols represent within group differences. Underlined symbols represent between groups differ.

