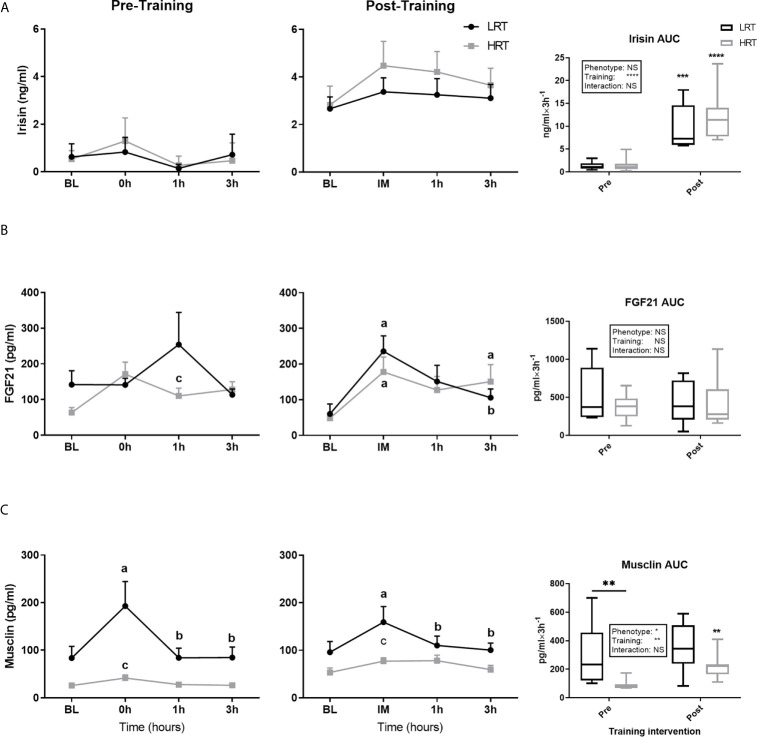
Figure 5.
Temporal change in concentration of plasma myokines and area under the curve (AUC) before and after exercise training. (A) Irisin (B) Fibroblast growth factors 21 (FGF21). (C) Musclin. Baseline (BL). Values are means±SD. Analysis via two-way ANOVA with Sidak’s post hoc test. Main effects are shown in the text box. *P≤0.05, **P<0.01, ***P<0.001, ****P<0.0001, NS, Not Significant. a= significant change from BL. b= significant change from 0h. c. significant change across groups. Non-underlined symbols represent within group differences. Underlined symbols represent between group differences.

