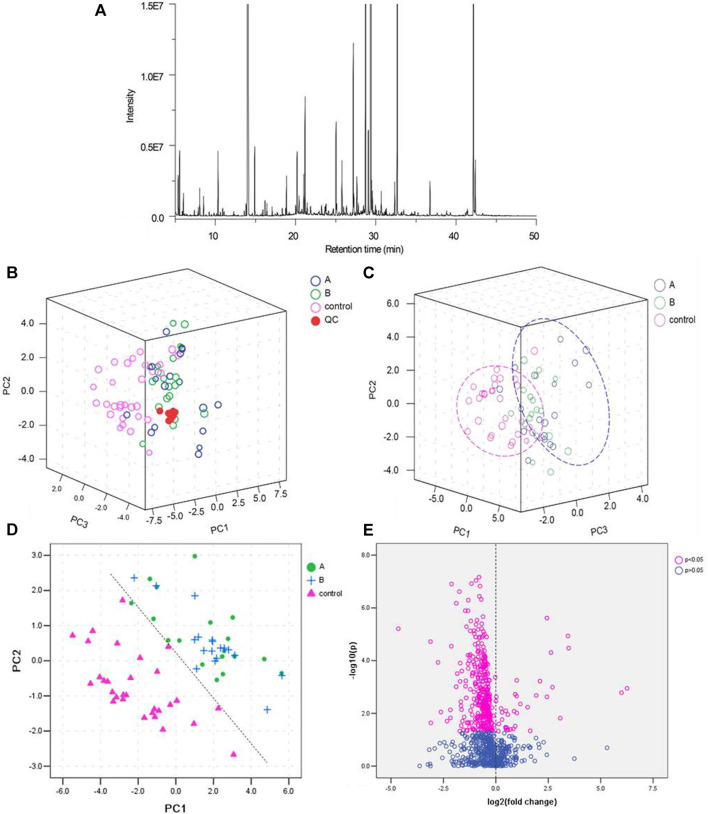
FIGURE 1.
Quality control (QC) of GC-MS analysis and partial least squares discriminant analysis (PLS-DA) of the urine samples. (A): Total ion chromatograms (TICs) of the urine samples; (B): PCA score scatter plots of QC samples from healthy subjects (control) and LDH patients (A with reality syndrome; B with deficiency syndrome); (C): PCA score scatter plots of urine samples from healthy subjects (control) and LDH patients (A with reality syndrome; B with deficiency syndrome); (D): PLS-DA score scatter plot of urine samples from healthy subjects (control) and LDH patients (A with reality syndrome; B with deficiency syndrome); and (E): volcano plot of urine metabolites in healthy subjects and LDH patients.

