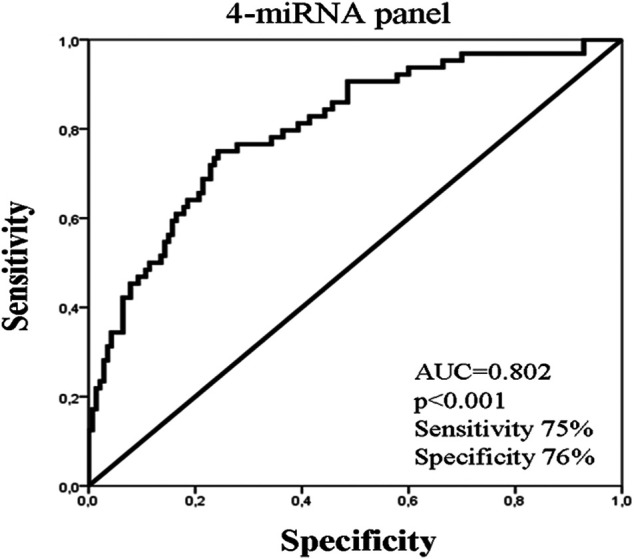
FIGURE 2.

ROC curve analysis depicting the performance of a 4-miRNA panel consisted of miR-19a, miR-20a, miR-126, and miR-155 to distinguish early from metastatic breast cancer patients. AUC, area under curve.

ROC curve analysis depicting the performance of a 4-miRNA panel consisted of miR-19a, miR-20a, miR-126, and miR-155 to distinguish early from metastatic breast cancer patients. AUC, area under curve.