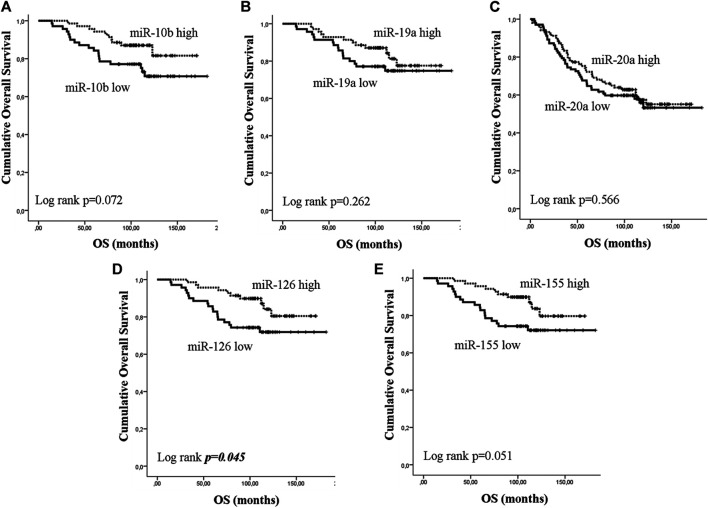
FIGURE 4.
Kaplan–Meier analysis for overall survival (OS) according to the expression of circulating miRNAs. Patients were classified as high or low expression groups based on the median value of each miRNA expression. OS in patients with high or low (A) miR-10b, (B) miR-19a, (C) miR-20a, (D) miR-126 and (E) miR-155. Curves were compared using the log rank test. P values are shown.

