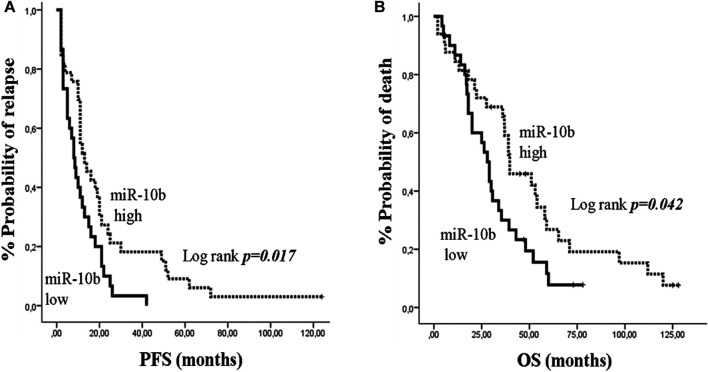
FIGURE 5.
Kaplan–Meier analysis for progression free survival (PFS) and overall survival (OS) according to the expression of circulating miR-10b in metastatic breast cancer patients. Patients were classified as high or low expression groups based on the median value of miR-10b expression. (A) PFS and (B) OS in patients with high or low miR-10b. Curves were compared using the log rank test. P values are shown.

