Figure 6.
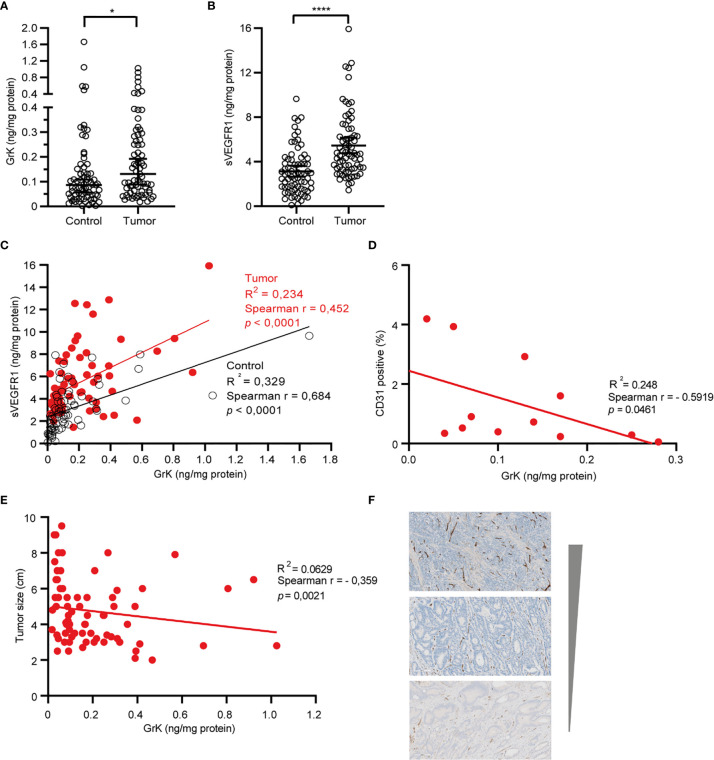
GrK and sVEGFR1 protein levels correlate in colorectal cancer tissue (A) Comparison of the concentration of sVEGFR1 in colorectal cancer and normal control (Wilcoxon signed rank test). Data were corrected for total protein levels. (B) Comparison of the concentration of GrK in colorectal cancer and normal control (Wilcoxon signed rank test). Data were corrected for total protein levels. (C) Correlation between sVEGFR1 and GrK concentrations in colorectal cancer and in normal control (Spearman’s rank correlation). (D) correlation between endothelial cells by CD31 and GrK in T4 colorectal cancer (Spearman’s rank correlation). (E) Correlation between GrK and Tumor size in colorectal cancer (Spearman’s rank correlation). (F) CD31 IHC staining of colorectal tumors. Three representative images are shown with high, intermediate and low amounts of angiogenesis Results are depicted as median and 95% CI. *P < 0.05; ****P < 0.0001.

