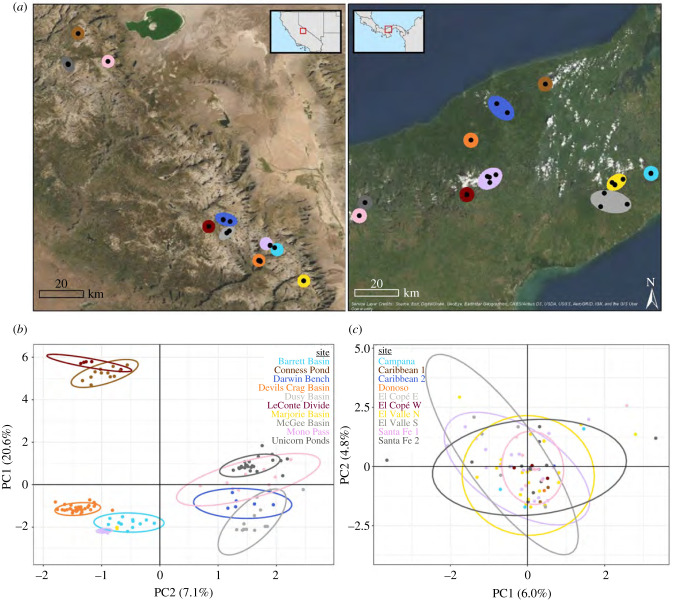
Figure 1.
Study system map and principal component analysis of within region genotypes. (a) Map of sites sampled in the study in the Sierra Nevada and Central Panama. (b) PCA within Sierra Nevada samples, coloured by the major site. Samples cluster by site, suggesting strong genetic structuring across the Sierra Nevada. (c) PCA within Central Panama samples, coloured by the site. Compared to samples from the Sierra Nevada, Central Panama samples exhibit a dramatically different pattern, i.e. panmixis, despite a similar spatial and temporal scale of sampling. Colours in (b,c) correspond to geographical locations in (a). (Online version in colour.)

