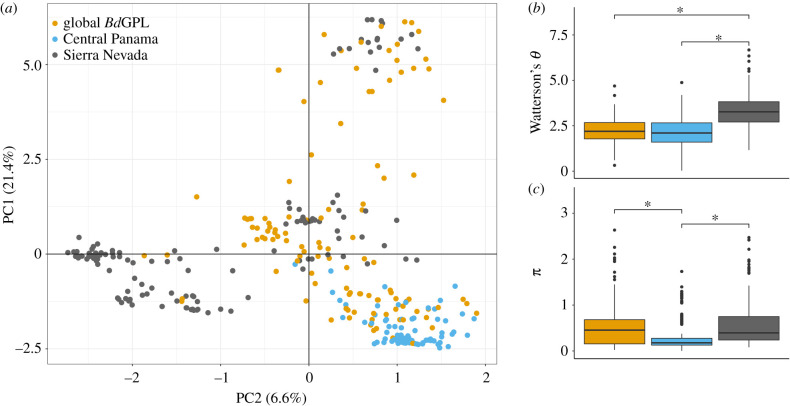
Figure 2.
Genetic differentiation and diversity among the Sierra Nevada, Central Panama, and global BdGPL samples. (a) PCA based on BdGPL genotypes from the Sierra Nevada (n = 130), Central Panama (n = 80) and global reference panel (n = 120). Colours indicate samples from each region. The global reference panel included samples from dozens of frog species across all continents with BdGPL. Samples from the Sierra Nevada and Central Panama are almost entirely separated in PC space with the Sierra Nevada samples showing greater genetic variation than Central Panama samples. (b) Distribution of mean genetic diversity (Watterson's θ) for all variable sites based on region. Samples from the Sierra Nevada and global panels were randomly subsampled to match Central Panama sample size (all regions n = 80). Mean genetic diversity was significantly higher for Sierra Nevada samples compared to Central Panama samples and to the global BdGPL panel [Tukey HSD, p < 0.0001]. (c) Distribution of mean nucleotide diversity (π) for all variable sites based on the region using the same samples as (b). Mean nucleotide diversity was significantly lower for Central Panama samples compared to Sierra Nevada samples and the global BdGPL panel [Tukey HSD, both p < 0.0001]. Each box plot shows the median (horizontal line), first and third quartiles (bottom and top of box, ‘hinges’), lowest and highest values within inter-quartile range of the lower and upper hinges (vertical lines) and outliers (points). (Online version in colour.)

