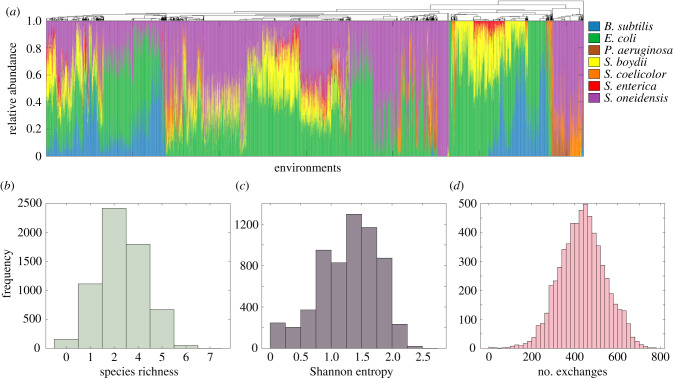
Figure 1.
Structural and ecological properties of simulated 13-species communities. (a) Relative abundances of organisms after 24 h of growth in all 6196 combinatorial environmental compositions. Only organisms that were present at the end of at least one simulation are shown. Environments are clustered based on species relative abundances (see Methods). (b–d). Distributions of species richness (b), Shannon entropy (c) and the total number of exchanges (d) observed across all environments. Here, one exchange is defined as the transfer of a unique metabolite from one organism to another, e.g. the secretion of metabolite m by organism A and its absorption by organism B represents one exchange. As our simulations contained 737 unique extracellular metabolites, the total possible number of exchanges (i.e. if each organism transfers each metabolite to each other organism) totals , or 57 486.

