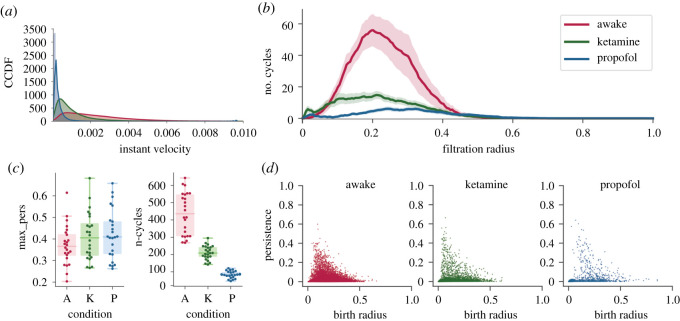
Figure 3.
Results for the EPC analysis of brain dynamical trajectories in the high-dimension configuration space. Empirical distributions of the instantaneous velocity for the three conditions (a). Average Betti curves, with a 90% confidence interval, counting the number of homological cycles present in the complex as the spheres radius increases (b). The life duration of the longest cycle in each time segment and total number of homological cycles (represented by a point in the swarm plots), separated by condition (A, awake; K, ketamine; P, propofol) (c). Persistence diagrams for all time series embedding separated by conditions. For each condition, a scatter point represents the birth radius and persistence of a cycle in one of the embedding point cloud (d).

