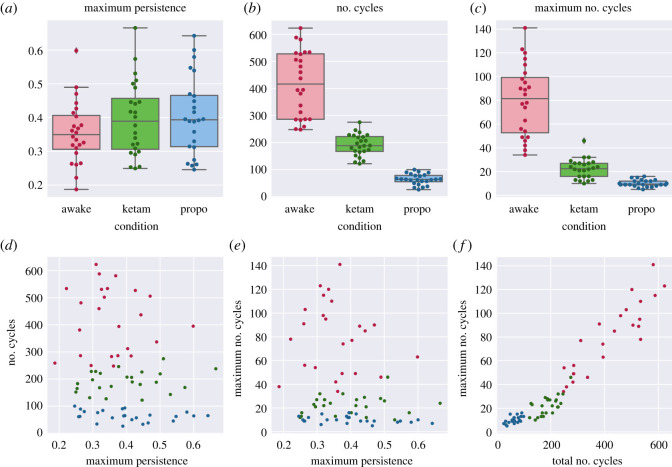
Figure 4.
(a,b) Boxplots showing how the three conditions differed on each of the TDA analyses applied to the EPC: the maximum persistent (a), the total number of cycles (b), and the maximum number of cycles (c). (d–f) scatter plots showing how the three measures above relate to each other. Note the strong positive relationship in (f), indicating that the total number of cycles is related to the largest number of cycles that appear at a given moment. ‘Cycles’ in this context can be understood as constraints on the behaviour of the system indicating a deviation from the case where all channels are acting independently.

