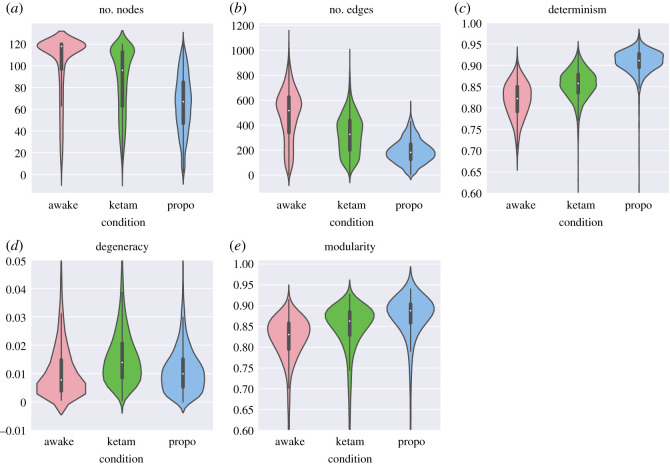
Figure 5.
Violin plots for the various OPN measures. Violin plots were chosen to represent the distribution of measures over thousands of individual channels. (a) The difference between the three conditions in the number of unique nodes present in the OPN. This represents something like a measure of the size of the repertoire of states available to the system in a given condition. (b) The number of unique edges in the OPN, represents the flexibility of the systems dynamics. (c) The determinism: an information-theoretic measure of how reliably the future of the system can be predicted from its past. (d) The degeneracy: a measure of how much information about the past is lost when different states ‘run into’ each other. This is a rare case where the ketamine condition is higher than either of the awake or propofol conditions. (e) The modularity of the OPN network, determined using the Infomap algorithm [69]. Provides a measure of how ‘constrained’ the systems dynamics are by higher-order patterns of state-transitions.

