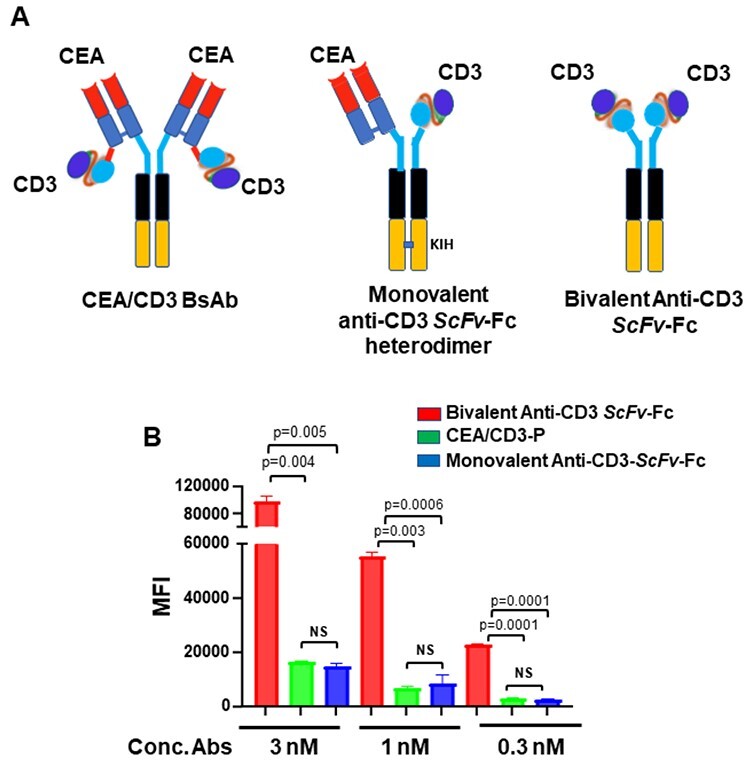
Figure 1.

Generation of CEA/CD3 bsAb. (A) shows the t-TCE format of CEA/CD3 bsAb (left), schematic of monovalent anti-CD3 ScFv-Fc heterodimer format (middle) and bivalent anti-CD3 ScFv-Fc (right). (B). Cell binding of the monovalent and bivalent CD3 abs to CD3 on Jurkat cells. CD3-expressing Jurkat cells were stained with 3, 1 and 0.3 nM concentrations of the antibodies. Each point represents median fluorescence intensity (MFI) mean values of triplicate well and the ±SEM is represented by error bars.
