
Figure 6.
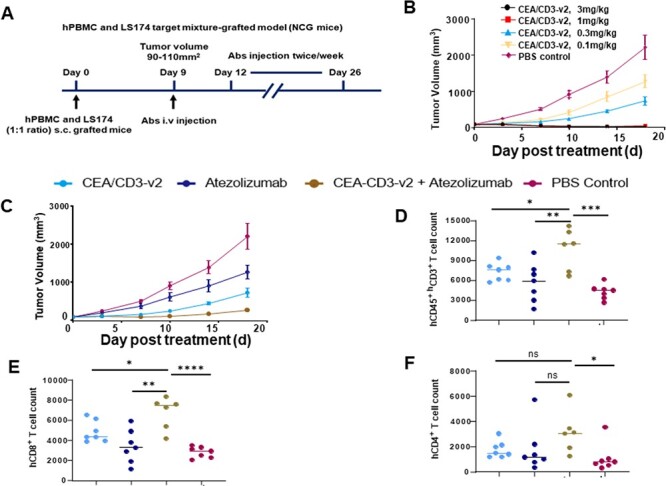
Treatment of CEA/CD3-v2 synergized with anti-PD-L1 antibody in hPBMC-NCG mice. (A) In vivo study design. (B) NCG mice were subcutaneously injected with mixture of hPBMCs (5 × 10⁶) and LS-174T cells (5 × 10⁶). Once tumor reaches between 90 and 110 mm3, the mice were randomly assigned (n = 6) and intravenous treatment of different doses of CEA/CD3-v2 (0.1, 0.3, 1 or 3 mg/kg) was initiated twice per week. Tumor growth was monitored every 3 days until the termination of the study. (C) Using the same protocol as (A), NCG mice were engrafted with mixture of hPBMCs and LS-174T cells and antibodies CEA/CD3-v2 (0.3 mg/kg) i.v. atezolizumab (20 mg/kg) i.p. alone or in combination was administered twice per week. The tumor growth curves showed mean ± SD. (D) Single live cell suspension of tumor samples from the antibody or vehicle control-treated mice were stained with antibody cocktails. The numbers of hCD45+CD3+(D), hCD8+ (E) and hCD4+ (F) TILs were calculated based on the frequencies of each cell types in 30 000 single live cells by flow cytometry assay. *P < 0.02, **P < 0.008, ***P < 0.0007, ****P < 0.000. t-test.