
Figure 3.
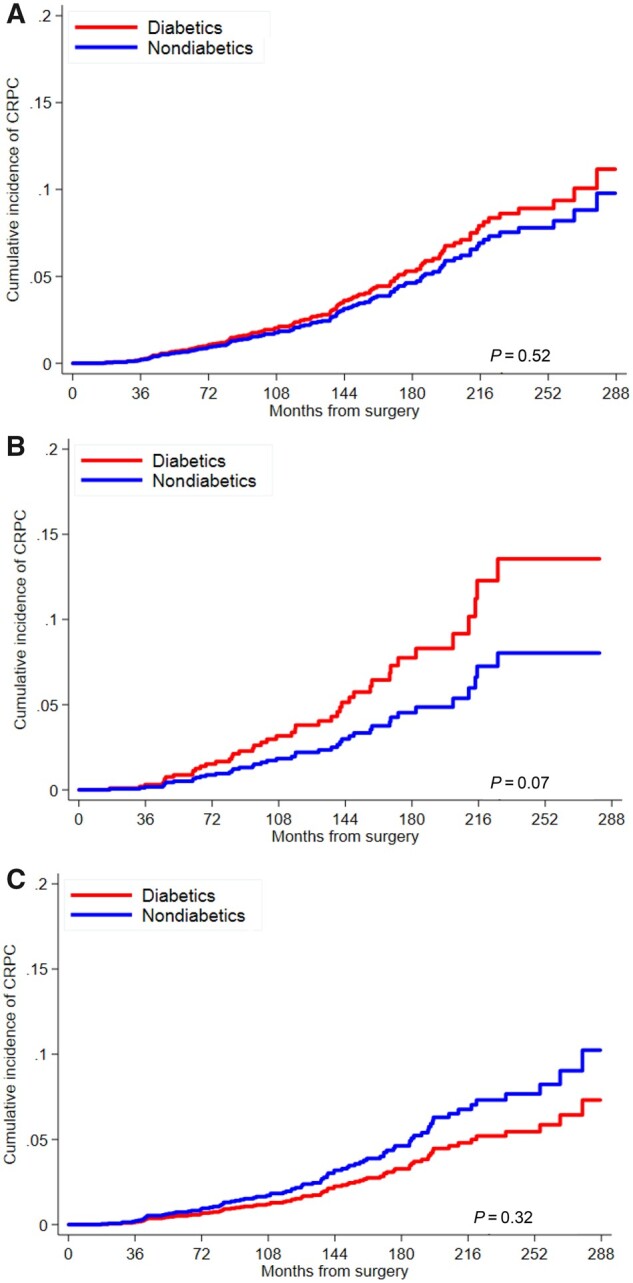
Cumulative incidence curve for risk of castrate-resistant prostate cancer (CRPC) by diabetes status among A) all men, B) obese men, and C) nonobese men. P values are from univariable Fine‐Gray subdistribution hazard model and are 2-sided.
Official websites use .gov
A
.gov website belongs to an official
government organization in the United States.
Secure .gov websites use HTTPS
A lock (
) or https:// means you've safely
connected to the .gov website. Share sensitive
information only on official, secure websites.
Cumulative incidence curve for risk of castrate-resistant prostate cancer (CRPC) by diabetes status among A) all men, B) obese men, and C) nonobese men. P values are from univariable Fine‐Gray subdistribution hazard model and are 2-sided.