Figure 1.

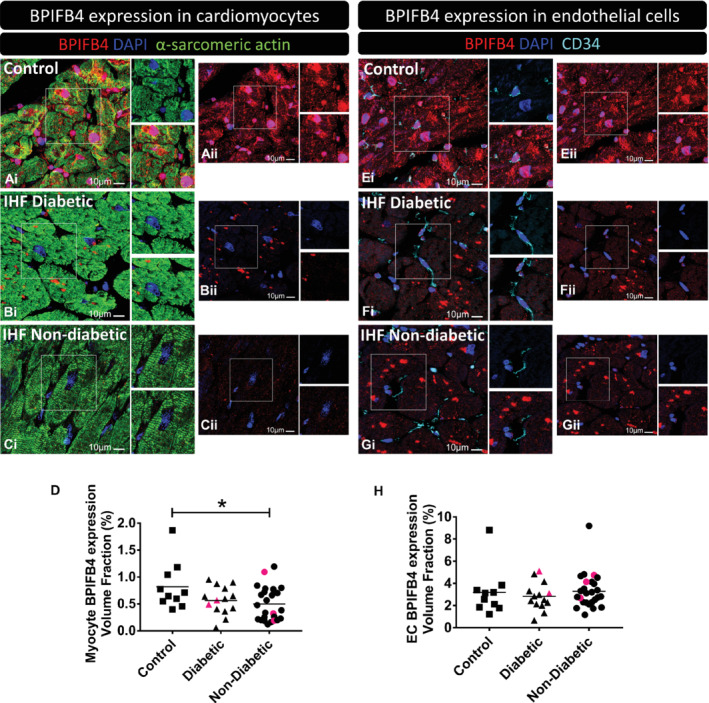
BPIFB4 expression in human cardiac samples. Samples were obtained from control hearts (A,E, control) and patients with ischaemic heart failure (IHF) with diabetes (B,F) or without (C,G). (A–D) BPIFB4 expression in cardiomyocytes. Fluorescence microscopy images show BPIFB4 in red fluorescence, cardiomyocytes α‐sarcomeric actin in green fluorescence, nuclei in blue (DAPI). (E–H) BPIFB4 expression in endothelial cells. BPIFB4 is in red fluorescence, CD34+ endothelial cells are shown with cyan pseudocolour, nuclei blue. All scale bars = 10 μm. The BPIFB4 channel (red) is provided also separately with the microphotographs labelled as (ii) for a better observation of the positive staining. In (D,H) data indicate the expression of BPIFB4 in cardiomyocytes (D) and endothelial cells (H) calculated as the positive volume fraction (percent of BPIFB4 positive staining in either cardiomyocytes or endothelial cells). In (D): n = 10 control, 14 diabetic, and 26 non‐diabetic. In (H): n = 10 control, 14 diabetic, and 26 non‐diabetic. Data are shown as individual values and mean. *P < 0.05 vs. controls. Red symbols correspond to carriers of the LAV‐BPIFB4 variant.
