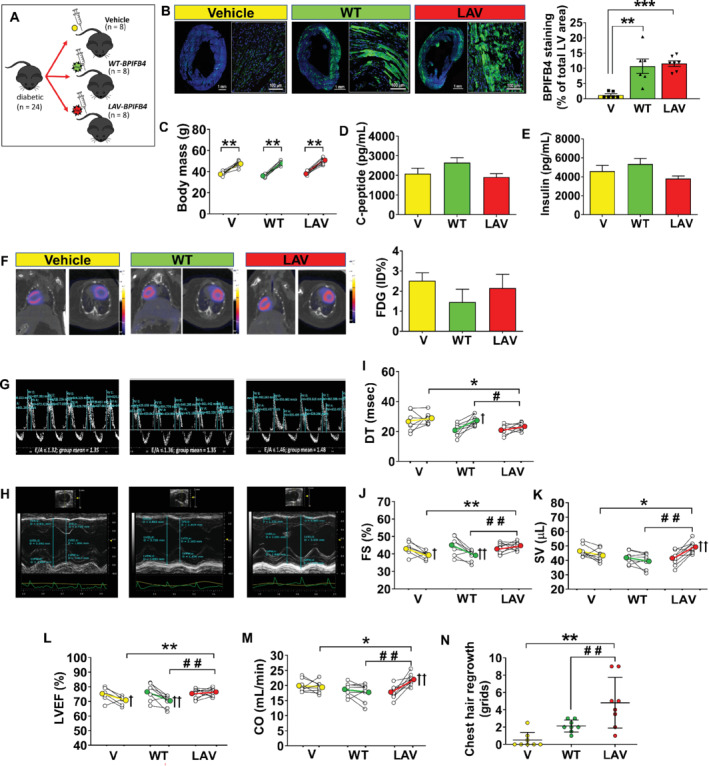
Figure 2.

LAV‐BPIFB4 gene therapy improves cardiac function in type 2 diabetic mice. (A) Diagram of mice randomisation (n = 8 mice per group). (B) Immunohistochemistry of BPIFB4 (green fluorescence) in the whole left ventricle (bar 1 mm) and a magnified section (bar 100 μm). Bar graph showing individual values and mean ± SEM of positive staining in the three groups. **P < 0.01, ***P < 0.001 vs. the vehicle group (V). (C) Body weight assessed at 8 and 13 weeks. Individual and mean values. **P < 0.01 vs. 8 weeks. (D–E) Peripheral blood levels of C‐peptide and insulin (mean ± SEM). (F) Representative images and bar graph (mean ± SEM) of 18F‐fluorodeoxyglucose (FDG) positron emission tomography/computed tomography imaging [values expressed as percent of injected dose (ID) per gram of tissue; n = 3 per group]. (G–M) Graphs showing results of echocardiography assessments at 8 and 13 weeks. Representative images of E and A waves measured using pulsed‐wave Doppler (G) and M‐mode traces (H). Graphs showing the improvement induced by AAV‐LAV‐BPIFB4 (LAV) on indices of diastolic and systolic function: (I) deceleration time (DT), (J) fractional shortening (FS), (K) stroke volume (SV), (L) left ventricular ejection fraction (LVEF), (M) cardiac output (CO). Data expressed as individual values and mean ± SEM; n = 8 mice per group. *P < 0.05 and **P < 0.01 vs. vehicle (V), # P < 0.05 and ## P < 0.01 vs. AAV‐WT‐BPIFB4 (WT), + P < 0.05 and ++ P < 0.01 vs. 8 weeks within the same group. (N) The degree of hair re‐growth determined at 13 weeks in the chest area depilated for performing echocardiography. A 9‐block grid system was used, with hair growth within grids scored 1–9, with a further score 9 for mice with complete hair re‐growth. Graph showing individual values and mean ± SEM in the three groups. **P < 0.01 vs. vehicle (V) and ## P < 0.01 vs. AAV‐WT‐BPIFB4 (WT).
