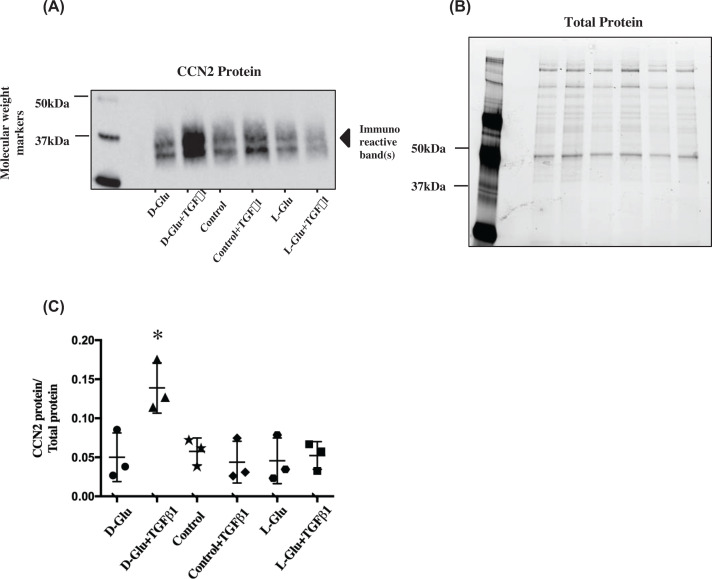
Figure 1. Effects of high glucose and TGF-β1 stimulation on PTECs that express CCN2.
(A and B) Image of Western blot immunostained for secreted CCN2 protein in PTECs under various treatments and the ‘Mini-PROTEAN TGX Stain-Free’ gel used for normalisation purposes. (C) Data points for secreted CCN2 (∼36/38 kDa) abundance normalised for total protein. The Mini-PROTEAN TGX stain-free gels used for normalisation contain a trihalocompound that automatically produces fluorescence when covalently crosslinked to protein tryptophan residues. After the proteins are separated by electrophoresis, crosslinking is carried out by exposing the gel to UV light. This is the band density normalisation process used for all subsequent experiments. D-Glu+TGF-β1 treatment significantly up-regulated CCN2 secretion. *P<0.05 compared with all other treatments, n=3. Black circles ● = D-Glu, black triangles ▲ = D-Glu+TGF-β1, black stars ★ = control, black diamonds ♦ = control + TGF-β1, black hexagons  = L-Glu, black squares ▓ = L-Glu + TGF-β1. Error bars indicate SD. Quantification of all proteins in these figures were a result of the light generated by the detection antibody indexed to total protein loaded in each sample. Control = 7 mM D-glucose, Control + TGF-β1 = 7 mM D-glucose + 0.75 ng/ml TGF-β1, D-Glu = 7 mM D-glucose + 18 mM D-glucose, L-Glu = 7 mM D-glucose + 18 mM L-glucose, D-Glu + TGF-β1 = 7 mM D-glucose + 18 mM D-glucose + 0.75 ng/ml TGF-β1, L-Glu + TGF-β1 = 7 mM D-glucose + 18 mM L-glucose + 0.75 ng/ml TGF-β1. This legend key is applicable to all subsequent figures.

