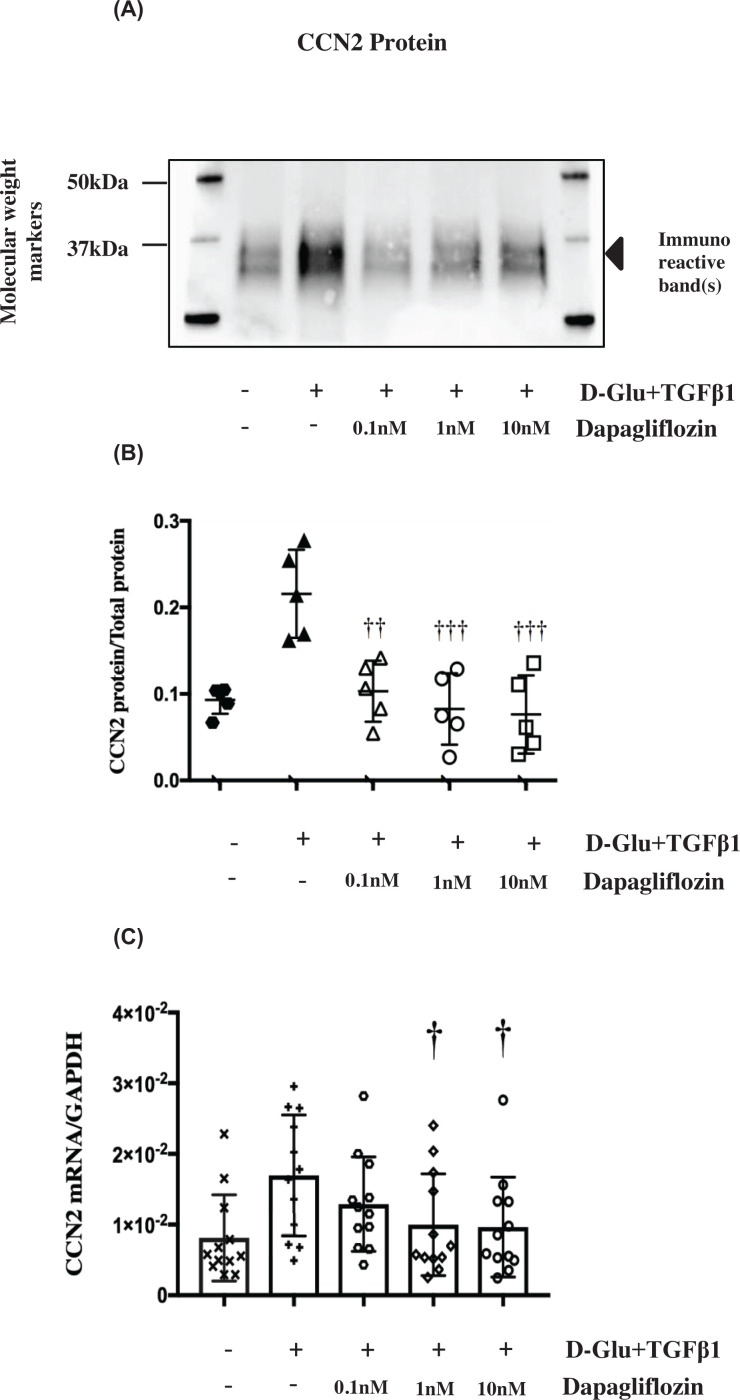
Figure 2. Effects of Dapagliflozin (dapa) on up-regulated CCN2 mRNA and protein in PTECs.
(A and B) Image of Western blot immunostained for secreted CCN2 protein in PTECs under various treatments. (C) Data points for secreted CCN2 (36–38 kDa) abundance normalised for total protein as mentioned above in Figure 1. Dapagliflozin at all three concentrations significantly attenuated CCN2 protein down to control levels; ††P<0.01 compared with D-Glu + TGF-β1, †††P<0.001 compared with D-Glu+TGF-β1, n=5. Black hexagons  = control, upward black triangles ▲ = D-Glu+TGF-β1, white triangles Δ = D-Glu+TGF-β1+0.1 nM dapa, white circles ○ = D-Glu+TGF-β1+1 nM dapa, white squares □ = D-Glu+TGF-β1+ 10 nM dapa. (D) Effects of 0.1, 1 and 10 nM dapagliflozin on up-regulated CCN2 mRNA (ΔCt of CCN2 to GAPDH) in PTECs. Dapagliflozin at 1 and 10 nM significantly attenuated CCN2 relative mRNA abundance to control levels. †P<0.05 compared with D-Glu+TGF-β1. Black X X = control, black cross + = D-Glu+TGF-β1, white hexagons
  = D-Glu+TGF-β1+0.1 nM dapa, white diamonds ◊ = D-Glu+TGF-β1+1 nM dapa, white circles ○ = D-glu+TGF-β1+ 10 nM dapa, n=12. Error bars indicate SD. Quantification of all proteins in these figures were a result of the light generated by the detection antibody indexed to total protein loaded in each sample. Control = 7 mM D-glucose, Control + TGF-β1 = 7 mM D-glucose + 0.75 ng/ml TGF-β1, D-Glu = 7 mM D-glucose + 18 mM D-glucose, L-Glu = 7 mM D-glucose + 18 mM L-glucose, D-Glu+TGF-β1 = 7 mM D-glucose + 18 mM D-glucose + 0.75 ng/ml TGF-β1, L-Glu + TGF-β1 = 7 mM D-glucose + 18 mM L-glucose + 0.75 ng/ml TGF-β1. This legend key is applicable to all subsequent figures.

