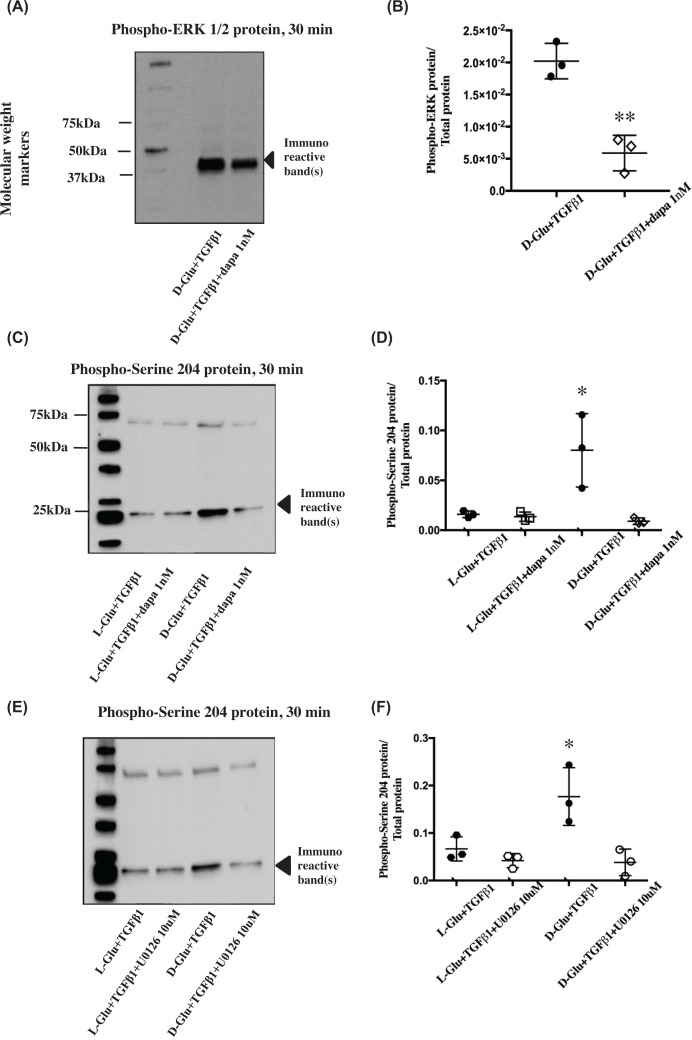
Figure 4. Phosphorylation state of Smad3 serine 204 and ERK after U0126 and dapagliflozin treatment.
(A) Image of Western blot immunostained for cellular phospho-ERK (∼40 kDa) protein in PTECs treated with dapagliflozin and (B) the corresponding data points for cellular phospho-ERK abundance normalised for total protein as mentioned above in Figure 1. Dapagliflozin significantly reduced the cellular content of phosphorylated ERK (∼40 kDa). **P<0.01 compared with D-Glu+TGF-β1+dapa 1 nM, n=3. (C) Image of Western blot immunostained for cellular phospho-serine 204 of Smad3 LR protein in PTECs treated with dapagliflozin and (D) the corresponding data points for cellular phospho-serine 204 of Smad3 LR abundance normalised for total protein. Dapagliflozin (1 nM) significantly reduced the cellular content of phosphorylated serine 204. *P<0.05 compared with D-Glu + TGF-β1 + dapa 1 nM, n=3. (E) Image of Western blots immunostained for cellular phospho-serine 204 of Smad3 LR protein in PTECs treated with U0126 and (F) the corresponding data points for cellular phospho-serine 204 of Smad3 LR (∼25kDa) abundance normalised for total protein. U0126 (10 μM) significantly reduced the cellular content of Smad3 phosphorylated serine 204 at 30 min. **P<0.05 compared to D-Glu + TGF-β1 + U0126, n=3. Black hexagons  = L-Glu + TGF-β1, white hexagons
  = L-Glu + TGF-β1 + U0126, black circles ● = D-Glu + TGF-β1, white circles ○ = D-Glu + TGF-β1 + U0126, white squares □ = L-Glu + TGF-β1, white diamonds ◊ = D-Glu + TGF-β1 + dapa 1 nM. Quantification of all phosphorylated proteins in these figures were a result of the light generated by the detection antibody indexed to total protein loaded in each sample.

