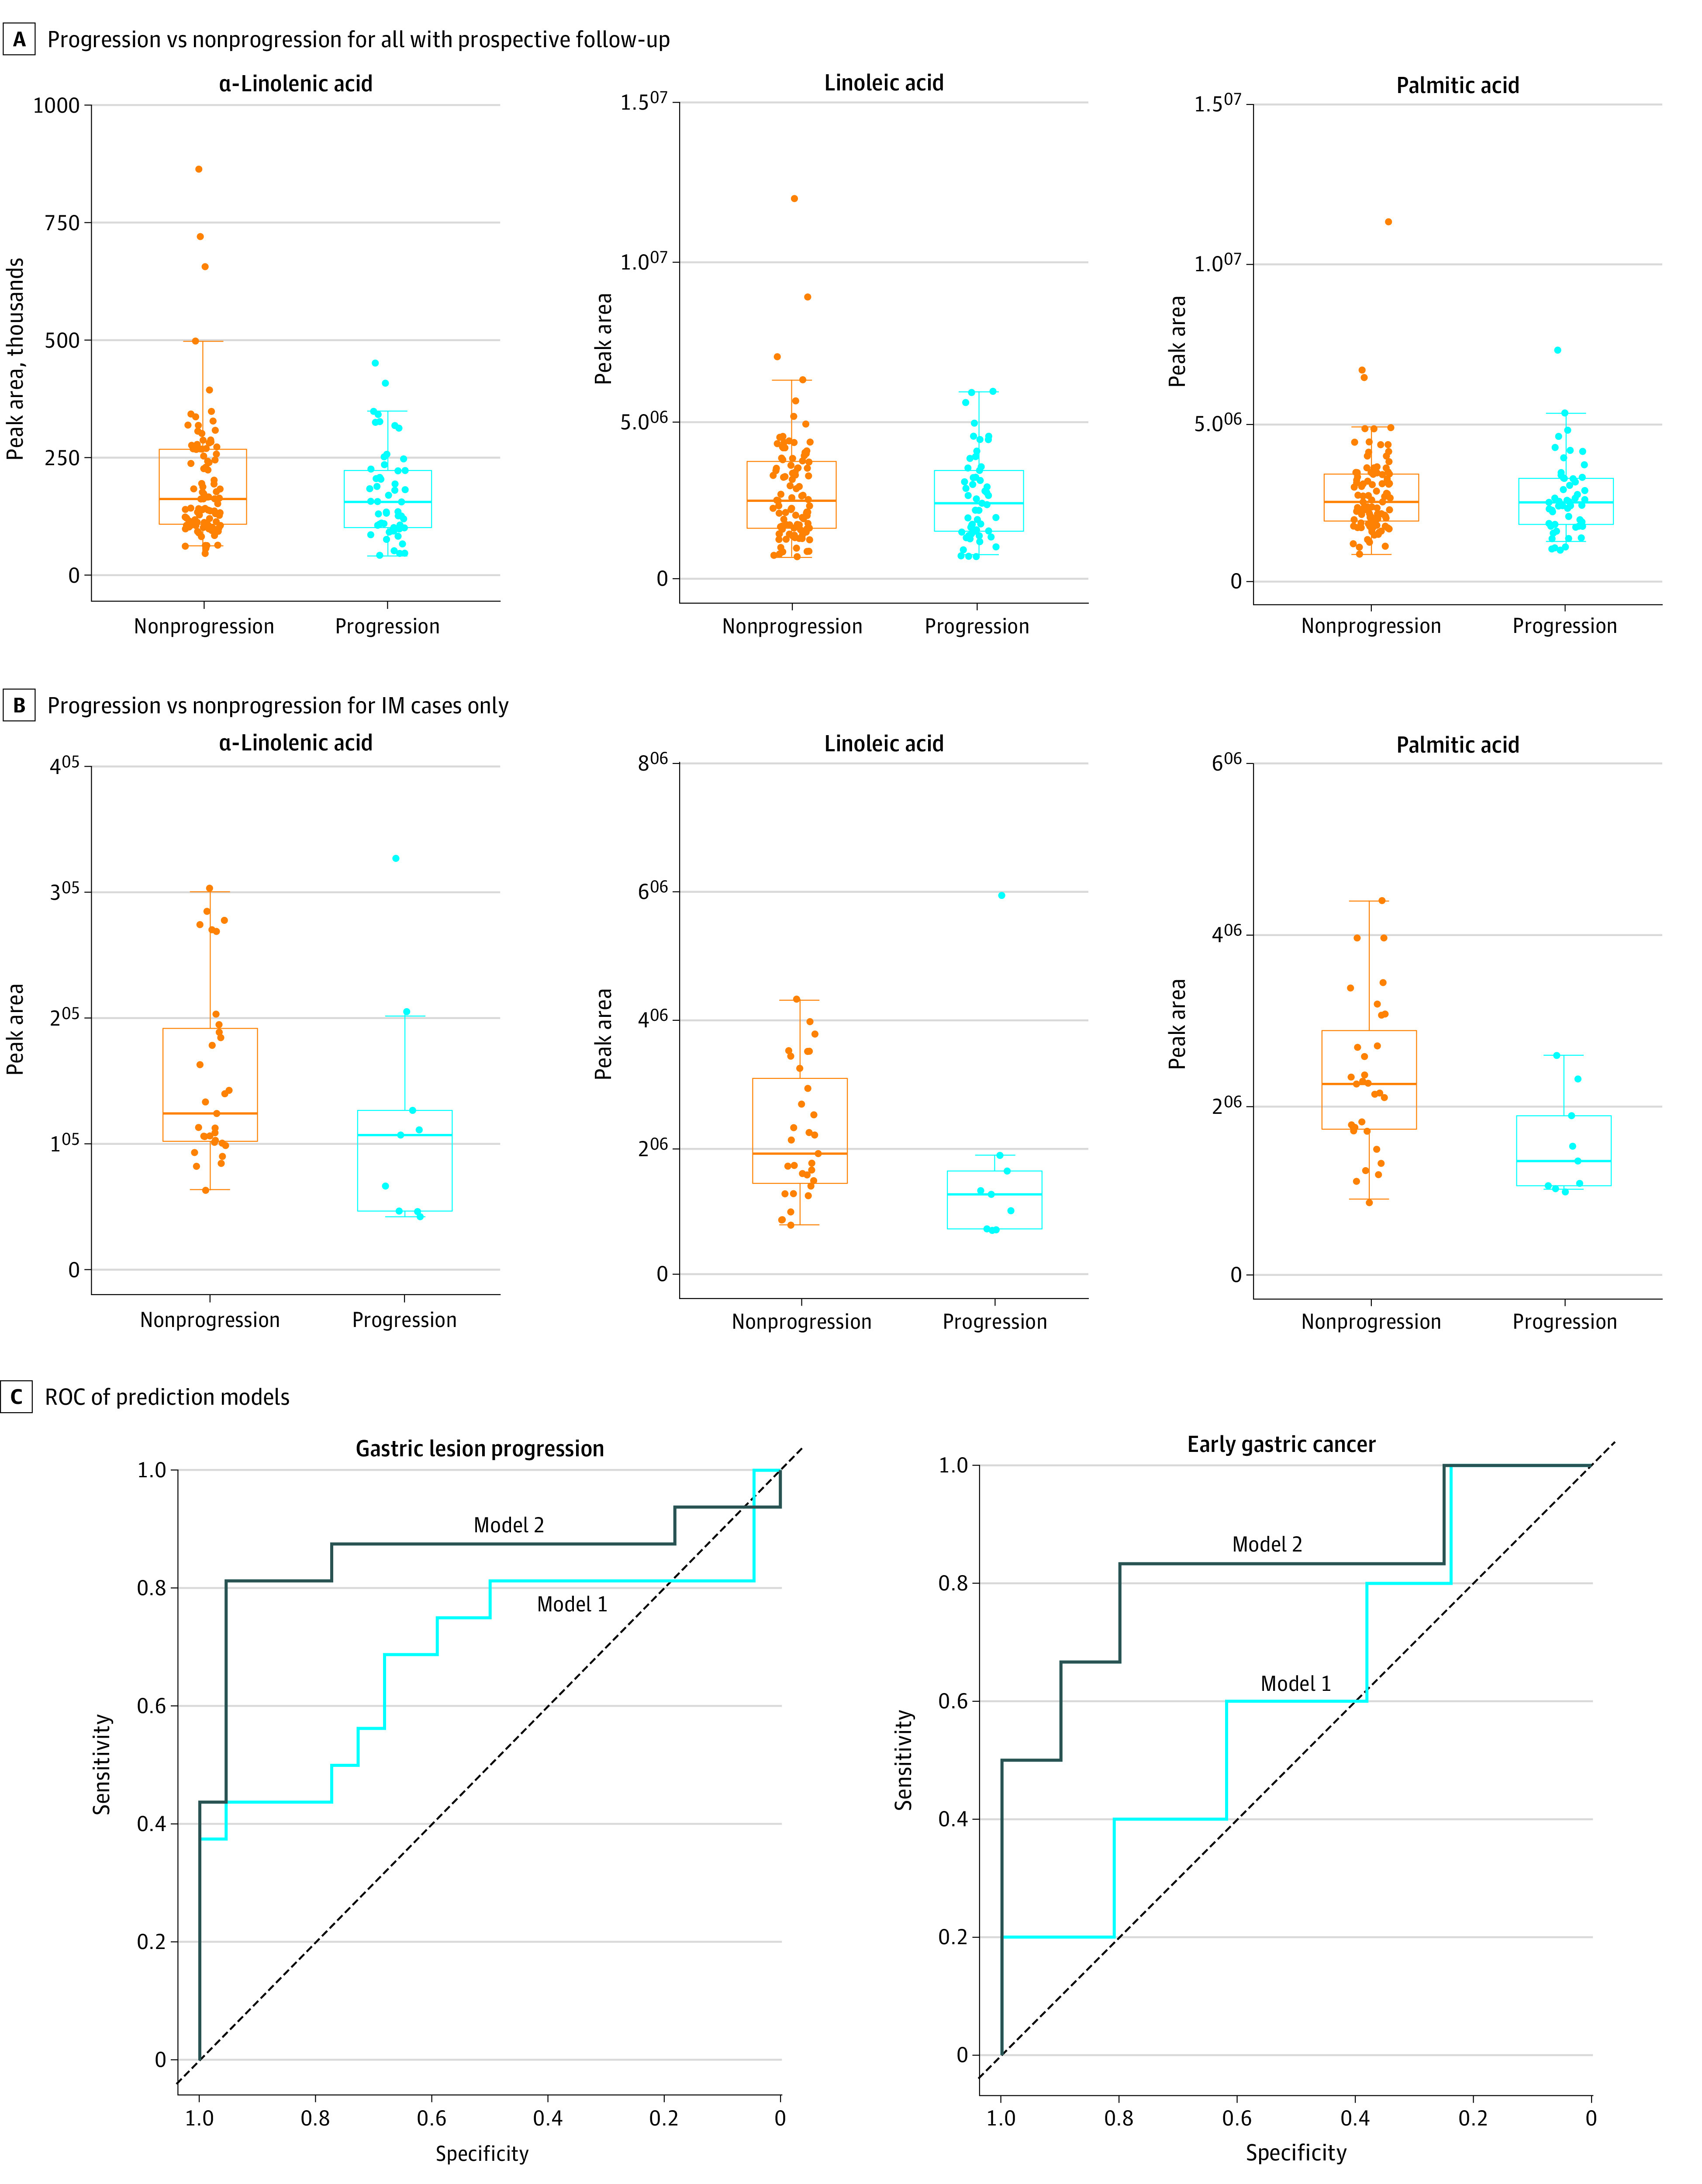
Figure 3. Validated Metabolites and Prediction Models for Gastric Lesion Progression and Risk of Early Gastric Cancer (GC).

A-B, P values are available in eTable 2 in the Supplement. C, Model 1: age, sex, H pylori infection, and baseline histologic factors; model 2: metabolic scores of the highlighted 3 metabolites. For gastric lesion progression, model 1: area under the curve (AUC), 0.69 (95% CI, 0.50-0.88); P = .05; model 2: AUC, 0.86 (95% CI, 0.70-1.00); P = 7.50 × 10⁻⁶. For early GC, model 1: AUC, 0.61 (95% CI, 0.31-0.91); P = .47; model 2: AUC, 0.83 (95% CI, 0.58-1.00); P = .009. IM indicates intestinal metaplasia; ROC, receiver operating characteristic.
