An official website of the United States government
Here's how you know
Official websites use .gov
A
.gov website belongs to an official
government organization in the United States.
Secure .gov websites use HTTPS
A lock (
) or https:// means you've safely
connected to the .gov website. Share sensitive
information only on official, secure websites.
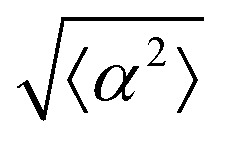
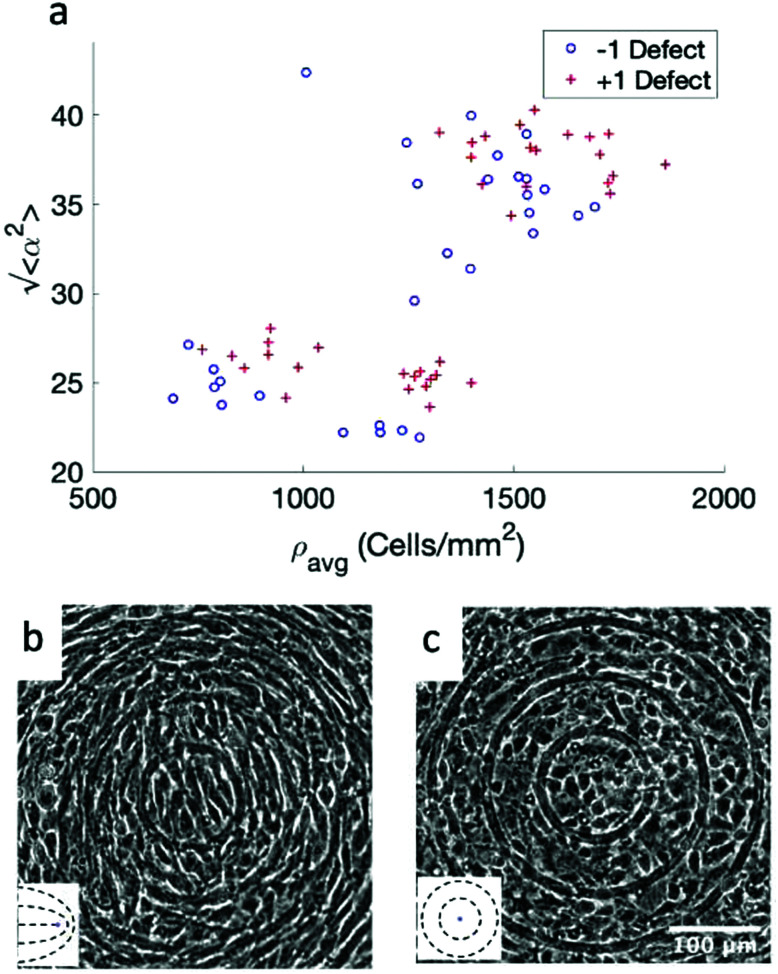
 , measuring the deviation from the ideal alignment, as a function of the average density of cell monolayers. Every point corresponds to the observation of cells near one defect, either positive (red crosses) or negative (blue circles). (b) Details of fibroblasts near a positive defect in a monolayer with density 1400 cells per mm2, showing good alignment. (c) Detail of fibroblasts near a positive defect with density 1700 cells per mm2, showing a smaller aspect ratio and worse alignment. For n = 30 negative defects and n = 39 positive defects, we observe a difference in the quality of alignment between cells with a density typically >1400 cells per mm2 and with a density <1400 cells per mm2, with p-value < 0.0001.