An official website of the United States government
Here's how you know
Official websites use .gov
A
.gov website belongs to an official
government organization in the United States.
Secure .gov websites use HTTPS
A lock (
) or https:// means you've safely
connected to the .gov website. Share sensitive
information only on official, secure websites.
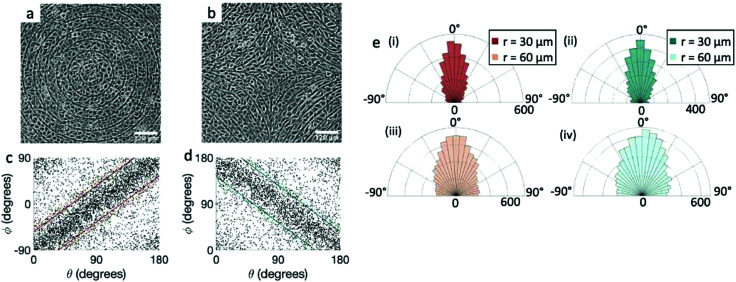
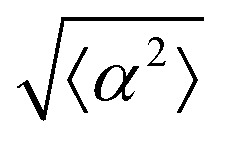 for r = 30 μm and r = 60 μm. (d) Scatter plot of EpH-4 alignment with r = 30 μm negative defect pattern. Lines of different shades indicate
 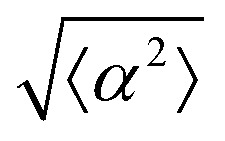 for r = 30 μm and r = 60 μm. (e) Alignment of EpH-4 with ridges of (i and ii) r = 30 μm and (iii and iv) r = 60 μm patterns around (i and iii) positive defects and (ii and iv) negative defects. (i) n = 4 samples and
 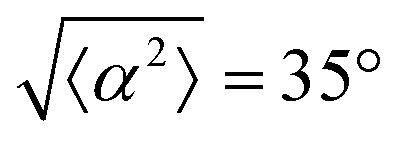 . (ii) has n = 3 and
 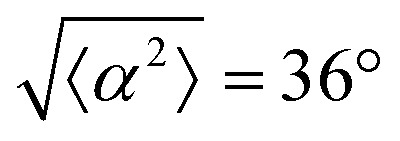 . (iii) has n = 5 and
 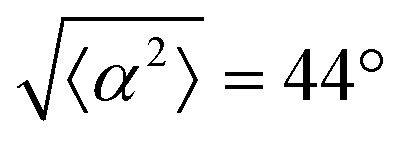 . (iv) has n = 5 and
 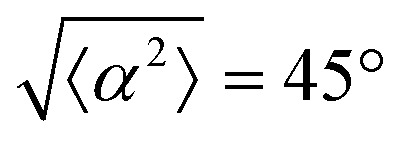 .
.