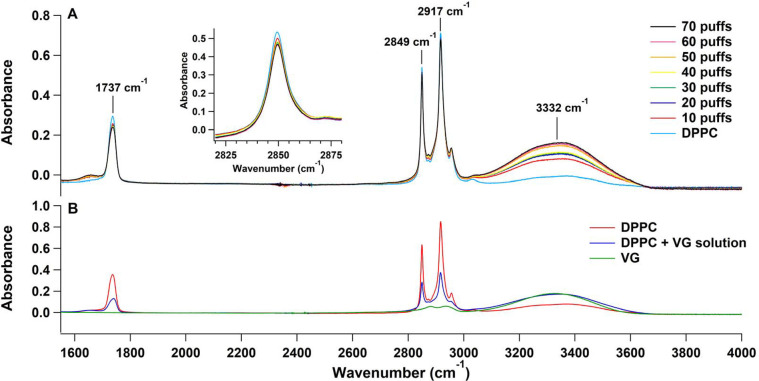
Figure 2.
(A) FTIR spectra of DPPC and after each session of 10 puffs of VG using the ENDS device. (B) ATR-FTIR spectrum of a concentrated VG solution placed on a clean ATR surface; a spectrum of DPPC placed on a clean ATR surface (in red), and the spectrum of the same DPPC after the addition of the concentrated VG solution (in blue).

