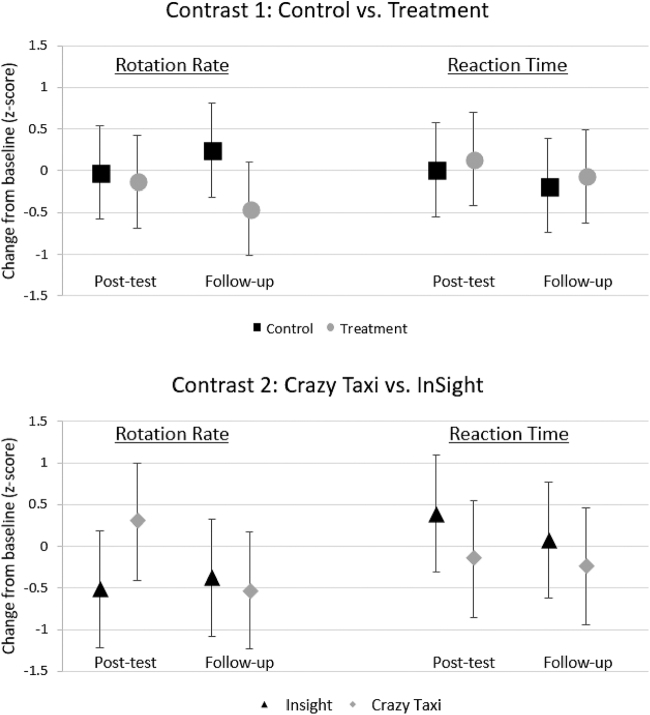
FIG. 1.
Planned contrast results are presented as standardized effect sizes. y-Axis represents difference from (i) baseline to immediate post-test or (ii) difference from baseline to 3-month follow-up, as labeled. Contrast 1 (top panel) compares the mean change score of untrained control participants (black square) with the average mean change score in both intervention groups (gray dot). Contrast 2 (bottom panel) compares the mean change score of the videogame intervention (Crazy Taxi, gray diamond) with the computerized training (InSight, black triangle). Error bars represent 95% confidence intervals. Negative values represent improvements from baseline (i.e., becoming faster).

